Analytics in Manufacturing Your Guide to Efficiency

Analytics in manufacturing is all about taking the raw data from your shop floor and turning it into clear insights you can actually use to boost efficiency, cut waste, and ship more products. It’s the shift from making decisions based on gut feelings and guesswork to a strategy backed by hard data and real-time information.
How Manufacturing Analytics Transforms the Factory Floor
Think of your factory floor like a professional sports team. Without analytics, the coach is just going by memory and intuition. But with analytics, that same coach can review game footage, track every player's stats, and pinpoint specific weaknesses in the other team. That's exactly what manufacturing analytics does for you—it provides the "game footage" for your entire production process.
Every machine, every step in your workflow, and every operator is constantly generating a stream of valuable data. When you gather and analyze this information, you start to see hidden patterns and opportunities for improvement that you’d never spot otherwise. It’s the difference between knowing a machine stopped and knowing exactly why it stopped, how often it happens, and what that downtime is costing you.
The Shift from Reaction to Prevention
For years, many manufacturers have been stuck in a reactive loop. A machine goes down, a batch fails a quality check, or a deadline gets missed, and the team scrambles to fix it. Manufacturing analytics flips this whole model on its head.
Instead of just reacting to problems, you can start anticipating them. By digging into your historical performance data, you can:
- Predict equipment failure before it grinds your production to a halt.
- Catch quality issues as they happen, not after you've created a pile of scrap.
- Spot production bottlenecks that are silently slowing down your entire operation.
This strategic move from being reactive to proactive isn't just a nice-to-have anymore; it's essential for staying competitive. The global manufacturing analytics market was valued between $12.8 billion and $15.2 billion in 2024 and is expected to hit around $44.1 billion by 2035. This boom is happening for a reason—companies are seeing a clear return on their investment from things like predictive maintenance and real-time quality control. You can dig into these trends in detailed industry reports.
Let's break down the key areas where this approach makes a real difference.
Key Focus Areas for Manufacturing Analytics
| Area of Focus | Key Objective | Example Metric |
|---|---|---|
| Operational Efficiency | Maximize output with existing resources | Overall Equipment Effectiveness (OEE) |
| Quality Control | Reduce defects and rework | First Pass Yield (FPY) |
| Supply Chain | Improve inventory management and flow | On-Time Delivery (OTD) |
| Maintenance | Minimize unplanned downtime | Mean Time Between Failures (MTBF) |
| Cost Management | Pinpoint and reduce operational expenses | Cost Per Unit |
Ultimately, a data-driven strategy ties all these areas together, giving you a complete picture of your factory's health and performance.
Unlocking Actionable Intelligence
At the end of the day, the goal here isn't just to collect a mountain of data. It’s about turning that data into intelligence that helps your team make better decisions. It connects the dots between different parts of your operation, giving everyone a single, unified view of what’s happening.
The true power of manufacturing analytics lies in making complex data simple. It gives every team member, from the operator to the CEO, clear insights they can use to make smarter decisions every single day.
This approach tears down the walls that often separate the shop floor from the front office. When everyone is working from the same source of truth, collaboration gets better, problems get solved faster, and the whole business becomes more nimble. To see how data can drive improvements at every stage of production, check out our other posts on the TimberCloud blog.
The Four Levels of Manufacturing Analytics
You don't need a Ph.D. in data science to get a handle on manufacturing analytics. The best way to think about it is as a journey up a ladder, with four distinct levels. Each rung takes you from simply looking at what’s already happened on your shop floor to actively controlling what happens next.
This progression starts with raw data at the bottom and climbs toward actionable intelligence at the top.
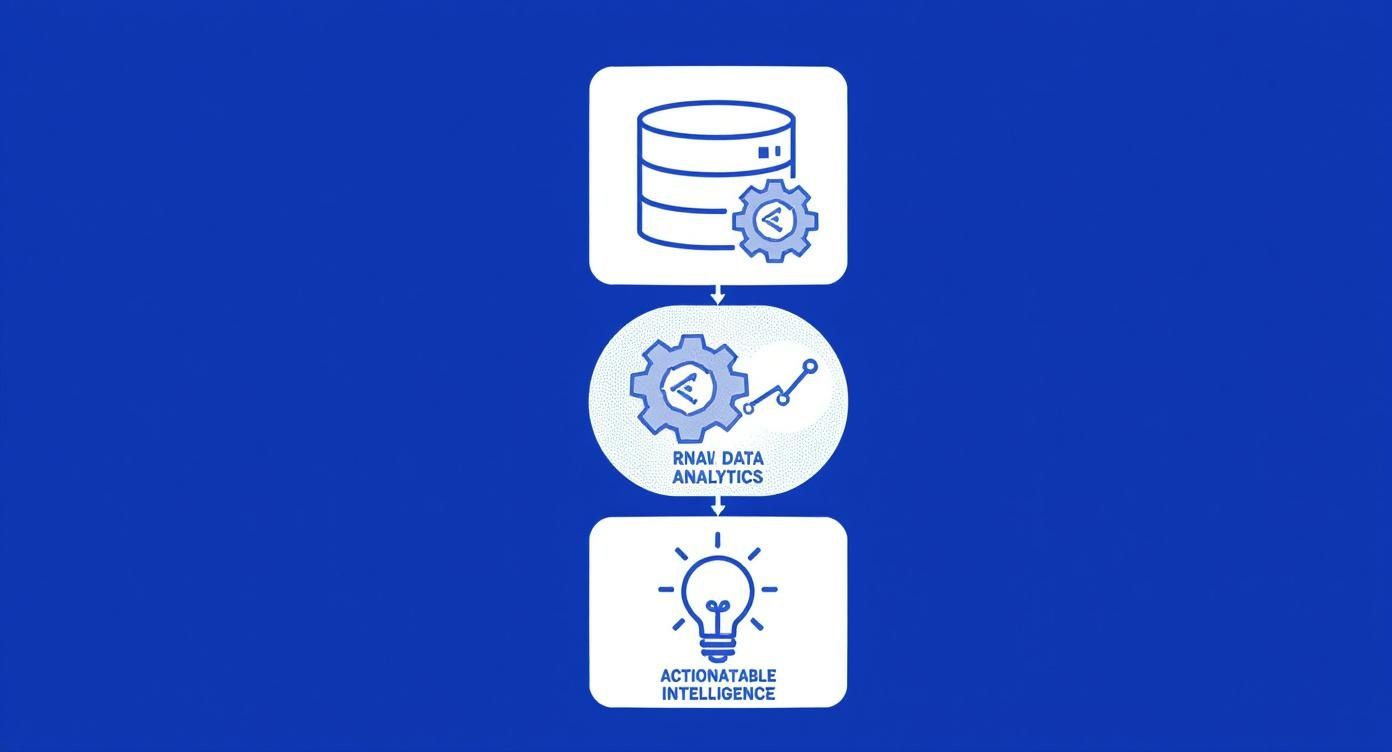
The idea is simple: raw data is just noise until you run it through the right analytics. Only then does it become the kind of insight that helps you make smarter decisions.
Level 1: Descriptive Analytics — What Happened?
Descriptive analytics is like your factory's rearview mirror. It takes all the raw, historical data from your machines and operations and organizes it into something you can actually understand, like dashboards, charts, and simple reports. This is where everyone starts.
Its only job is to answer one question: "What happened?"
A typical descriptive dashboard will show you the hard facts. Things like:
- The total number of cabinets assembled during last Tuesday's second shift.
- How many minutes of downtime your main CNC router had over the past month.
- The exact scrap rate for that big custom millwork job.
This level is all about visibility. It won't tell you why something happened, but it gives you the concrete numbers to spot trends and flag areas that need a closer look. You can't get to the other levels without this solid foundation.
Level 2: Diagnostic Analytics — Why Did It Happen?
Once you know what happened, the obvious next question is why. This is where diagnostic analytics comes in. Think of this as the investigation phase, where you start digging into the data to find the root cause of an issue or, just as importantly, a success. It’s all about connecting the dots.
It answers the crucial follow-up question: "Why did it happen?"
This is where you put on your detective hat. If your descriptive report shows a sudden spike in scrap, your diagnostic tools help you investigate the clues. You might discover a clear link between that high scrap rate and a new batch of material, a less-experienced operator, or a machine that was running just a few degrees hotter than usual. You’re no longer just seeing a problem; you’re starting to understand its source.
Diagnostic analytics is what turns raw numbers into a story. It connects a production problem to its cause, letting you fix the actual issue instead of just patching up the symptoms.
Level 3: Predictive Analytics — What Will Happen Next?
Predictive analytics is where you pivot from looking at the past to getting a glimpse of the future. By feeding historical data into statistical models and machine learning algorithms, this level helps you figure out the likelihood of future outcomes. It’s like getting a weather forecast for your production line.
It’s all about answering the forward-looking question: "What will happen next?"
This is where the real power of modern analytics in manufacturing starts to shine. Instead of waiting for a critical machine to fail, a predictive model can analyze vibration, temperature, and performance data to warn you about a potential breakdown days or even weeks ahead of time.
Other powerful examples include:
- Forecasting customer demand for a specific product line based on seasonal patterns and past sales data.
- Predicting which jobs are most likely to run into quality control issues before they even start.
This ability to see around the corner allows you to schedule maintenance before a costly failure, adjust your inventory to meet upcoming demand, and step in to prevent quality problems. The savings in time, money, and headaches can be enormous.
Level 4: Prescriptive Analytics — What Should We Do About It?
This is the top of the ladder and the most advanced level of analytics. Prescriptive analytics doesn't just tell you what's likely to happen; it recommends specific actions you should take to either get the best possible result or avoid a looming problem. It’s like having an expert advisor built right into your systems.
It answers the ultimate operational question: "What should we do about it?"
Building directly on predictive insights, a prescriptive tool might recommend the optimal machine settings to push throughput to its maximum while keeping energy consumption low. If it predicts a machine failure, it could go a step further by automatically scheduling a maintenance work order and ordering the necessary replacement parts. In a complex shop, it could even suggest rerouting jobs to avoid a predicted bottleneck, making sure you hit your deadlines.
Mapping Your Data Sources and Core KPIs
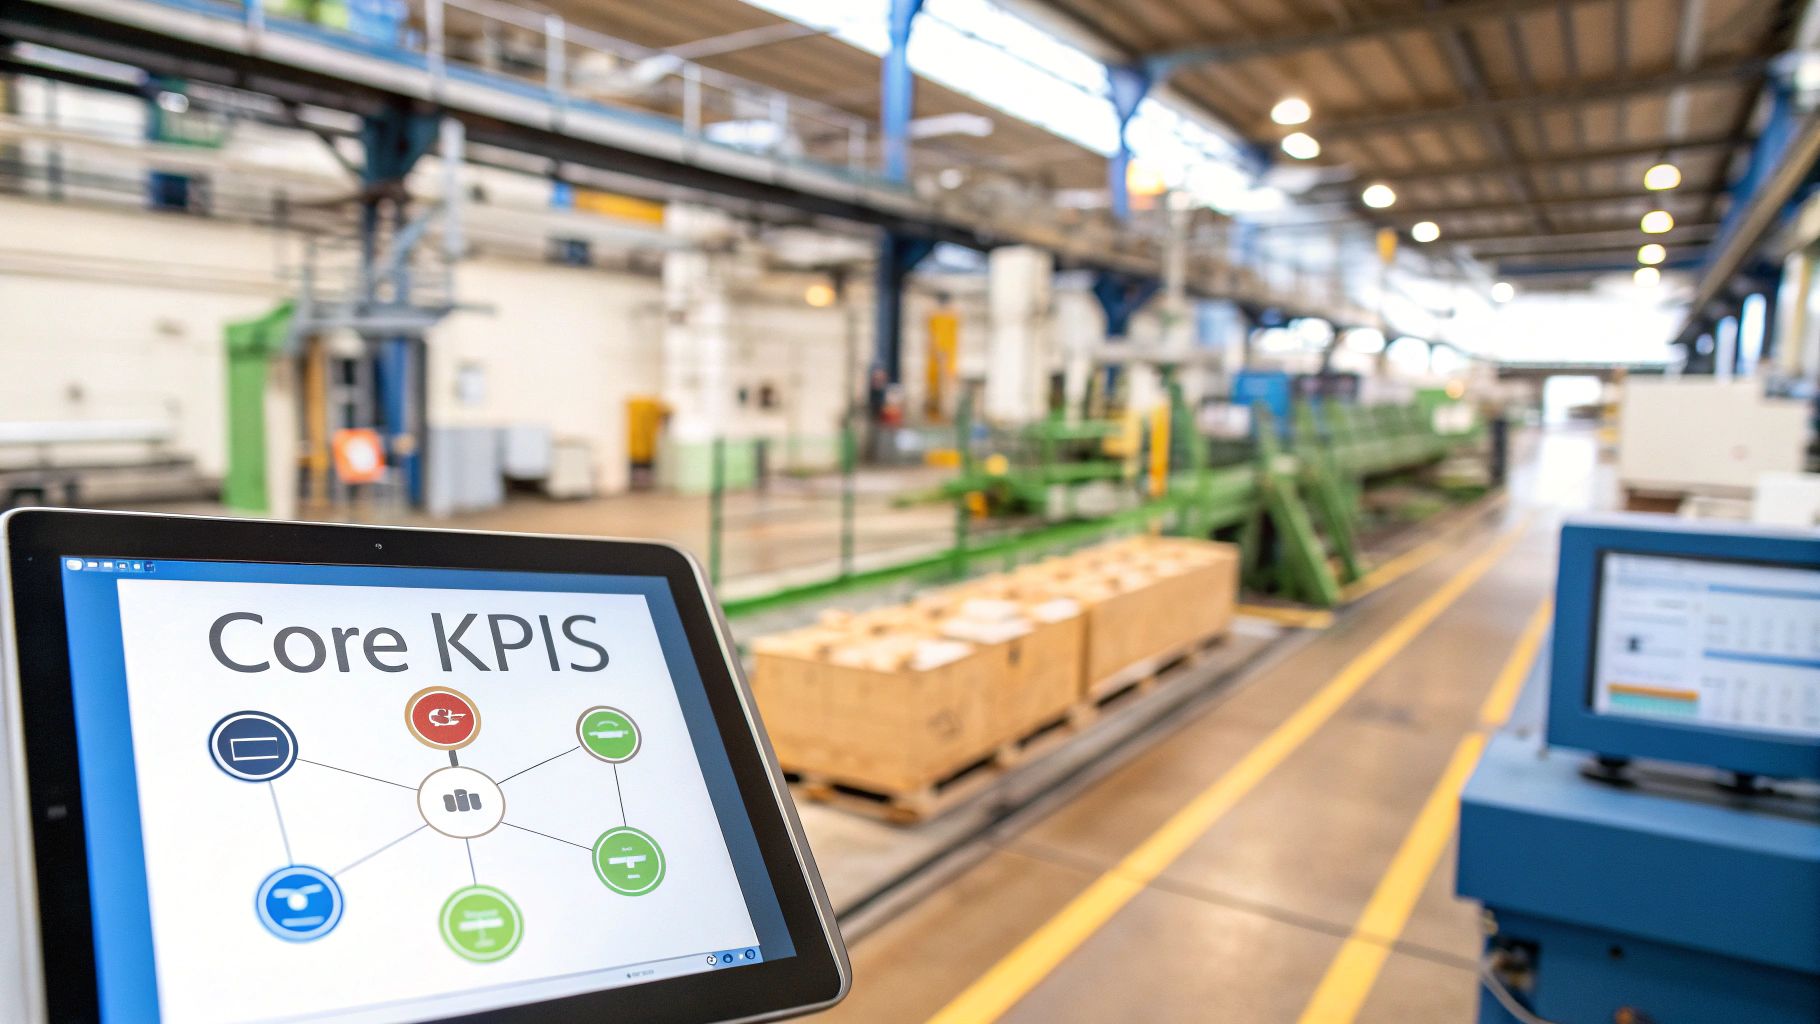
Getting started with manufacturing analytics is all about knowing two things: where your data lives and what it’s trying to tell you. Think of your shop floor as a living system. Every machine, every operator, and every process is constantly generating signals. The goal is to capture all those signals to get a complete, honest picture of your factory's health.
These data sources are the foundation for everything. You can have the fanciest analytics software in the world, but if the data feeding it is junk, your insights will be too. It’s the classic "garbage in, garbage out" problem. So, the first real step is to find and connect all these digital touchpoints.
Uncovering Your Primary Data Sources
The good news is that your shop is already a goldmine of information. You just have to know where to look and how to bring it all together.
Here are the most common places you'll find that data:
- Machine Data: This is the raw feedback coming straight from your equipment's PLCs and sensors. It gives you the ground truth on what's happening second by second—machine status (running, idle, down), cycle times, temperatures, and even vibrations.
- Manufacturing Execution Systems (MES): Your MES is the storybook of your production floor. It tracks work orders from start to finish, logging operator performance, quality checks, and every piece of material consumed along the way.
- Enterprise Resource Planning (ERP): The ERP holds the big-picture business data—customer orders, inventory levels, supply chain details, and financials. Connecting this to your shop-floor data is how you tie production activity directly to your bottom line.
- Operator Inputs: Sometimes, the "why" behind a problem isn't something a sensor can capture. Simple inputs from your team on a tablet or terminal can explain the reasons for downtime, flag a quality issue, or note a setup adjustment.
When you pull these different streams together, you create a single source of truth. This holistic view is what lets you move past surface-level stats and start seeing how one part of your operation truly affects another. This isn’t just a nice-to-have anymore; it's becoming a global standard. In fact, the Asia-Pacific region is a great example, with an expected CAGR of about 15.2% through 2030 in manufacturing analytics adoption. You can learn more about these global manufacturing trends and forecasts.
Focusing on the KPIs That Truly Matter
Once your data is flowing, you have to decide what’s worth measuring. Key Performance Indicators (KPIs) are the vital signs for your business. The trick is to avoid drowning in a sea of numbers and instead focus on a handful of metrics that directly reflect your goals.
A KPI should be more than just a number; it should be a conversation starter. If a metric doesn't inspire a question or drive an action, it's probably not the right one to track.
Let's break down four of the most important KPIs in any manufacturing operation.
Overall Equipment Effectiveness (OEE)
OEE is the gold standard for measuring productivity. It boils down three critical factors into a single score, telling you exactly how close you are to running a "perfect" shop floor.
- Availability: (Run Time / Planned Production Time) – Are your machines running when they’re supposed to be? This measures losses from downtime.
- Performance: (Ideal Cycle Time × Total Count) / Run Time – How fast are you running? This measures speed losses from slow cycles or minor stops.
- Quality: (Good Count / Total Count) – Are you making good parts? This measures losses from defects and rework.
The final formula is straightforward: OEE = Availability × Performance × Quality. A score of 100% is perfection—only good parts, as fast as possible, with zero downtime. For most shops, a world-class OEE score is considered 85%.
Throughput
Simply put, throughput measures how much stuff you're actually making in a given period. It's a direct, no-nonsense indicator of your production capacity and efficiency.
You can calculate it as: Throughput = Total Units Produced / Time. This KPI helps you understand your real output, spot bottlenecks holding you back, and accurately forecast whether you can meet customer deadlines.
Scrap Rate
This one hits you right in the wallet. Scrap rate measures the percentage of materials or products that are wasted during production. A high scrap rate means you're throwing away money on materials, labor, and machine time that never turns into a sellable product.
The formula is: Scrap Rate = (Total Scrap / Total Product Run) × 100. Keeping a close eye on this number helps you jump on quality issues, operator errors, or material defects before they get out of hand.
Lead Time
Lead time is the total time it takes to get an order into a customer's hands, from the moment they place it to the moment it’s delivered. It’s a crucial measure of your responsiveness and efficiency, and it has a huge impact on customer satisfaction.
It’s calculated as: Lead Time = Order Delivery Date – Order Request Date. Cutting down lead time means optimizing every single step of your process—from order entry and engineering all the way through production and shipping.
Putting Analytics to Work on the Shop Floor
Theory is one thing, but the real magic of manufacturing analytics happens when the rubber meets the road—or in our case, when the saw blade meets the wood. Let's step away from the abstract and look at how real woodworking and millwork shops are using data to make tangible improvements. We're talking about turning information into dollars by cutting waste, speeding up production, and keeping customers happy.
Think about a custom cabinet shop that's always fighting high material costs. They start by simply tracking the offcuts from their CNC routers. Pretty soon, the data starts telling a story.
It might reveal that one nesting program consistently leaves behind large, awkward remnants, while another is far more efficient. Or maybe one operator’s setup process generates 15% more scrap than their coworkers. Armed with that knowledge, the shop can fine-tune its G-code, provide targeted training, and instantly boost its material yield. That’s a direct hit to the bottom line.
Slashing Lead Times by Finding the Real Bottleneck
Here’s another common scenario. A custom door manufacturer keeps losing bids because their lead times are too long. Everyone on the floor thinks the big, expensive CNC machine is the slowpoke holding things up. But the data tells a different story.
After analyzing the flow of work from one station to the next, they discover the actual bottleneck isn't the CNC at all. It's the finishing department. Parts are stacking up, waiting to be sanded and sprayed, creating a logjam that backs up the entire production line.
With this crystal-clear insight, the solutions become obvious and affordable:
- Move People Around: They cross-train an employee from a less busy area to help out in finishing during peak hours.
- Smooth Out the Workflow: They tweak the schedule to feed a more consistent stream of parts to the finishers, avoiding the "all-at-once" rush.
- Make a Smarter Investment: Instead of dropping a fortune on a new CNC they don't need, they invest in a second, smaller finishing booth—a much cheaper fix that directly solves the problem.
The result? Their lead times drop significantly. They start winning more bids, and customers are happier.
Analytics is like an X-ray for your shop. It lets you see past the surface-level symptoms to find the true source of the pain, so you’re always fixing the right problem.
Boosting OEE by Understanding Your Downtime
Let's visit a high-end furniture maker who was pulling their hair out over an Overall Equipment Effectiveness (OEE) score stuck at a mediocre 60%. They knew their primary edgebander was the main culprit for downtime, but the stoppages felt completely random.
So, they started collecting better data. Every time the machine stopped, the operator logged not just how long it was down, but why. After just a few weeks, a pattern jumped out from the data. The biggest time-killers weren't catastrophic breakdowns. They were a series of small, nagging issues: glue pot temperature swings and frequent jams from warped edge banding.
This knowledge gave them a clear, simple action plan:
- Tweak the Checklist: They added a quick glue pot calibration to the daily startup procedure.
- Talk to Suppliers: They got on the phone with their edge banding supplier to sort out the material quality issues.
- Empower Operators: They created a simple troubleshooting guide for fixing the most common jams in under a minute.
A few months later, their OEE was consistently hitting over 75%. That’s a huge jump in capacity without spending a dime on new equipment. Seeing how systems can provide this level of detail is key; you can explore the features of a unified platform like TimberCloud to get a better idea.
Implementing Dynamic Pricing with Real-Time Data
Finally, picture a millwork company that completely ditched its old, static price book. They decided to build a dynamic pricing model by connecting their quoting tool directly to live data from their ERP and the shop floor.
Now, when a salesperson puts together a quote, the price isn't just a generic calculation. It flexes based on what’s happening in the business right now:
- Current Shop Load: If the production schedule is packed, the price might nudge up slightly to account for a longer lead time. If there's a gap next week, the system might offer a small discount to fill it.
- Live Material Costs: The quote pulls the absolute latest plywood and hardware prices from the inventory system, protecting margins from market volatility.
- True Job Complexity: Analytics helps them more accurately predict the actual machine time and labor needed for tricky, non-standard jobs.
This isn't just a smarter way to quote; it's a way to align the sales team perfectly with the day-to-day reality of the shop floor, ensuring every job is priced for profit.
Your Roadmap to Implementing Manufacturing Analytics
https://www.youtube.com/embed/MvTavHZRP8E
Jumping from the idea of analytics to a living, breathing system on your shop floor can feel like a huge leap. But it doesn't have to be. The best approach isn't a massive, disruptive overhaul; it’s more like building a strong foundation and adding to it, brick by brick.
This roadmap breaks the journey down into four logical phases. The goal is to get some quick wins, prove the value, and build momentum for the long haul. Don't try to boil the ocean by connecting every machine and tracking every metric on day one. Pick one high-impact problem—a bottleneck machine, a line with quality issues—and make that your pilot.
Phase 1: Start with Smart Data Collection
Before you can find any insights, you need good, clean data. This first phase is all about creating the digital nervous system for your shop. You're tapping into the information your equipment is already generating or could be with a few small tweaks.
Here’s where you start:
- Connect Your Machines: Most modern woodworking equipment has a Programmable Logic Controller (PLC) that acts as its brain. The first step is plugging into these PLCs to get a direct feed of real-time data on machine status, cycle times, and error codes.
- Install Key Sensors: What about older equipment? Or what if you need to track something the PLC doesn't, like vibration or humidity? Affordable sensors are your friend. They can track variables crucial for things like predictive maintenance.
- Capture Operator Input: Not all data is machine data. Simple tablets or terminals on the floor let operators add vital context—logging downtime reasons, flagging a bad batch of material, or noting a quality issue.
By focusing on a single machine or production line first, you can get a stream of valuable data flowing without a huge upfront investment.
Phase 2: Integrate Your Disparate Systems
Raw machine data is interesting, but it becomes truly powerful when you connect it to the rest of your business. This phase is about breaking down the walls between the shop floor and the front office to create one source of truth.
This means linking your new production data feed to your core business software.
The goal of integration is to tell a complete story. It’s how you connect a machine’s downtime directly to a delayed customer order or link a change in material costs to the profitability of a specific job.
The most important connection you'll make is with your Enterprise Resource Planning (ERP) system. This is how you tie shop-floor activity back to inventory, scheduling, and the bottom line. Platforms like TimberCloud are designed specifically for this, acting as a bridge to ensure data from sales, production, and accounting all speak the same language. This gives you a complete picture, which is essential for making smart decisions.
Phase 3: Visualize Your Progress with Dashboards
Now that your data is flowing and connected, it's time to make it useful for everyone. A good dashboard turns a sea of numbers into simple, at-a-glance visuals that instantly show what's working and what needs attention. And this isn't just for the managers in the office—it's a game-changer for operators on the floor.
Your dashboards should be built for their audience:
- For Operators: Show them real-time performance for their specific machine or work area. A simple gauge showing progress toward a daily goal can be a huge motivator.
- For Plant Managers: Give them a bird's-eye view of the entire floor, tracking key KPIs like OEE, throughput, and scrap rates across different lines.
- For Executives: Create a high-level summary that connects operational metrics to financial performance, clearly showing the ROI of your analytics program.
The best dashboards are clean, intuitive, and focused. They answer critical questions in seconds and let you drill down for more detail when something looks off.
Phase 4: Level Up with Advanced Applications
With a solid foundation of data collection, integration, and visualization in place, you’re ready to move into the really exciting stuff. This is where you go from understanding what happened yesterday to accurately predicting what will happen tomorrow.
A perfect example is predictive maintenance. By analyzing historical vibration and temperature data from a critical CNC router, you can build a model that spots trouble long before a bearing seizes or a motor fails. This lets you turn an unexpected, multi-day shutdown into a planned, one-hour repair during off-hours. This kind of forward-looking capability is what turns a good analytics program into a great one, giving you a powerful competitive edge.
Implementation Roadmap Stages
To successfully deploy manufacturing analytics, it helps to think in distinct stages, each with a clear purpose. This phased approach ensures you build a robust system from the ground up, starting with the fundamentals and advancing toward more sophisticated capabilities that drive significant business value.
| Phase | Key Activities | Primary Goal |
|---|---|---|
| Phase 1: Foundation | Connect PLCs, install sensors, set up operator input terminals. | Establish a reliable, real-time data stream from a pilot area on the shop floor. |
| Phase 2: Integration | Connect machine data to ERP, MES, and other business systems like TimberCloud. | Create a single, unified view by combining operational data with business context. |
| Phase 3: Visualization | Design and deploy role-specific dashboards for operators, managers, and executives. | Make data accessible and actionable for everyone in the organization. |
| Phase 4: Optimization | Develop predictive maintenance models, dynamic pricing algorithms, and lead time forecasts. | Move from reactive problem-solving to proactive, data-driven decision-making. |
By following this structured path, you can manage complexity, demonstrate value at each step, and ensure your investment in manufacturing analytics pays off.
Avoiding Common Pitfalls and Measuring Your ROI
Jumping into manufacturing analytics can feel like a direct route to a smarter shop floor, but the path has its share of bumps. It's not as simple as installing some software and watching the magic happen. To get it right, you have to know what to watch out for.
The biggest tripwire is almost always poor data quality. If the numbers coming from your machines and operators are off, any insights you get are useless. It’s the old "garbage in, garbage out" problem, and it's a surefire way to make everyone lose faith in the system before you even get started.
Getting Ahead of the Problems
You can sidestep most of these headaches by being strategic from day one. A little planning goes a long way in keeping your team aligned and preventing wasted effort.
- Have a Goal: Don't just collect data because you can. Figure out what you're trying to fix. Is it too much scrap coming off the CNC? Is one particular workcell a constant bottleneck? Start there.
- Trust Your Data: Before you do anything else, make sure your data sources are reliable. That means checking that machine sensors are calibrated correctly and giving operators a simple, standard way to log information.
- Get Your Team On Board: New technology can feel like "big brother" is watching. Bring your shop floor crew into the conversation early. Show them how the data will help them do their jobs better, not just track their every move. When your team sees it as a tool for them, they’ll actually want to use it.
The real win isn't just about the technology itself—it's about building a culture where people use data to make better decisions. Success happens when everyone, from the operator to the owner, understands what the numbers mean and feels empowered to act on them.
A Simple Framework for Measuring ROI
To keep the momentum going, you need to prove that your investment is paying off. Calculating your Return on Investment (ROI) doesn't have to be a complicated accounting exercise. Just focus on the real, measurable wins that hit your bottom line.
The key is to know your starting point. Track your performance before you flip the switch on your analytics system, then compare it to the results you get afterward.
1. Calculate Tangible Savings These are the most straightforward wins—direct cost reductions. A perfect example is scrap reduction. Let's say you were losing $5,000 a month in wasted material. If you can get that down to $2,000, you’ve just put $3,000 back in your pocket. Every single month.
2. Quantify Increased Revenue This is all about efficiency gains. When you improve throughput, you’re making more products with the same people and machines. If analytics helps you boost a line's output by 10%, you’ve just created a 10% revenue increase from that line without adding overhead.
3. Account for Cost Avoidance Don't forget to measure the problems you prevented. This is where predictive maintenance really shines. A critical machine going down unexpectedly can easily cost you $10,000 in a single day between lost production and emergency repairs. If you prevent just one of those failures a year, the system has paid for itself.
When you add up these three areas, you can build a powerful case for your analytics program. It's all about weighing the investment against the return. You can get a clear idea of potential costs by looking at transparent pricing for platforms like TimberCloud, which makes it easier to match your budget to your goals.
Common Questions About Manufacturing Analytics
Diving into manufacturing analytics can feel like a big leap. Let's tackle some of the most common questions that come up when shops are getting started.
Where Do I Even Begin?
The best way to start is to think small. Forget about connecting every single machine and sensor on day one. Instead, pick one specific, nagging problem you want to solve.
Maybe it's that one CNC router that always seems to be down, or a finishing line that produces way too much scrap. Focus all your initial efforts there. By collecting and analyzing data from that single point of pain, you can score a quick win, prove the value, and build the momentum you need to expand.
What's This Going to Cost Me?
The cost can range from a very manageable monthly subscription for a cloud-based tool to a major capital investment for a massive enterprise system. But honestly, the initial price tag isn't the most important number to look at. The real focus should be on your Return on Investment (ROI).
Any good analytics solution should pay for itself, and then some. You'll see it in real, tangible results:
- Improved Efficiency: Getting more parts out the door without adding more staff or hours.
- Less Waste: Catching errors early and cutting down on costly material scrap.
- Greater Throughput: Unlocking hidden capacity you didn't even know you had.
A smart move is to run a small pilot project first. Prove the financial benefit in one area before you go all-in on a plant-wide system.
Do I Need to Hire a Data Scientist?
Not at all, especially when you're just starting out. Modern analytics platforms are built for the people who actually run the shop floor—the plant managers, engineers, and supervisors.
These tools are designed with clear dashboards and straightforward visuals, not complex code. They empower your existing team to find the answers they need without having a PhD in statistics. The goal is to get practical, actionable information into the right hands, fast.
This means your team can start using data to make better decisions right away, without a long learning curve.
Ready to turn your shop floor data into a competitive advantage? TimberCloud provides an all-in-one platform that integrates sales, ERP, and production analytics into a single workflow. Discover how TimberCloud can transform your operations.
Topics
TimberCloud Team
Content Team
The TimberCloud team is dedicated to helping manufacturers streamline their operations with intelligent software solutions.