10 Key Performance Indicators for Production Managers in 2025

Manufacturing KPIs (key performance indicators) are the metrics a production manager uses to measure how efficiently a shop converts materials, machine time, and labor into finished product.
The ten that matter most are Overall Equipment Effectiveness (OEE), production volume, defect rate, equipment downtime, on-time delivery, labor productivity, first pass yield, cycle time, changeover time, and Overall Line Effectiveness (OLE). For a custom woodworking shop, tracking even the first five will tell you exactly where jobs, hours, and margin are leaking — total output alone tells you almost nothing.
The 10 Manufacturing KPIs Every Production Manager Should Track
- Overall Equipment Effectiveness (OEE) — availability × performance × quality, in one score
- Production volume / output rate — how much finished product leaves the shop per period
- Defect rate — the share of parts that fail to meet spec
- Equipment downtime — hours a machine was available to run but didn't
- On-time delivery — the percentage of jobs that ship by the promised date
- Labor productivity — output per labor hour actually worked
- First pass yield — the share of parts made correctly without rework
- Cycle time — how long one unit takes to produce once work begins
- Changeover time — minutes lost between one job and the next on a machine
- Overall Line Effectiveness (OLE) — OEE's logic applied across a whole production line
Manufacturing KPIs by the Numbers
- Discrete manufacturers average 66.8% OEE, with world-class performance at 85% or higher. (Godlan 2025 OEE benchmark analysis of 1,470+ discrete manufacturing operations)
- Unplanned downtime drains large industrial companies of roughly 11% of annual revenue, up from 8% in 2019. (Siemens, The True Cost of Downtime, 2024)
- 83% of industrial decision-makers say unplanned downtime costs at least $10,000 per hour. (ABB / Sapio Research, October 2025)
- 92% of manufacturers say smart manufacturing will be the primary driver of competitiveness over the next three years. (Deloitte 2025 Smart Manufacturing Survey, 600 executives)
Read those together and the case for measurement makes itself: the average shop is leaving nearly a third of its equipment capacity on the table, and the cost of not noticing is measured per hour.
1. Overall Equipment Effectiveness (OEE)
Overall Equipment Effectiveness (OEE) is the gold standard for measuring manufacturing productivity. It’s not just one metric; it's a composite score that reveals the true productive capacity of your equipment by multiplying three critical factors: Availability, Performance, and Quality. This holistic view prevents the common mistake of improving one area at the expense of another, making it one of the most vital key performance indicators for production managers.
A low OEE score instantly pinpoints where your production process is breaking down, whether it's excessive downtime (low Availability), slow cycle times (low Performance), or high defect rates (low Quality).
Why OEE is a Game-Changer
OEE transforms abstract production goals into a tangible, measurable target. It provides a universal language for efficiency that connects the shop floor to the executive suite. Companies like Toyota and Siemens use OEE not just as a metric but as a cornerstone of their continuous improvement culture, achieving world-class scores of 85% and higher. By focusing on OEE, you shift from simply being busy to being truly productive.
How to Measure and Improve OEE
The formula is straightforward: OEE = Availability × Performance × Quality.
- Availability: Measures downtime losses. Calculated as .
Run Time / Planned Production Time - Performance: Measures speed losses. Calculated as .
(Ideal Cycle Time × Total Count) / Run Time - Quality: Measures defect losses. Calculated as .
Good Count / Total Count
Actionable Tip: Don't try to measure everything at once. Start by tracking OEE for a single bottleneck machine. Use this initial data to identify the biggest loss category and focus your improvement efforts there for a quick, impactful win.
Improving OEE requires a systematic approach. Engage your operators and maintenance teams directly; they are your best source of information on why equipment stops or runs slowly. Hold weekly meetings to review OEE trends and brainstorm solutions. Set incremental improvement targets, such as a 5% increase per quarter, to maintain momentum without overwhelming your team.
Platforms like TimberCloud are essential for capturing the real-time data needed for accurate OEE calculations. By integrating machine data directly, you eliminate manual tracking errors and get an honest assessment of your operations. Learn more about how TimberCloud's production tracking features can help you automate OEE monitoring.
2. Production Volume / Output Rate
Production Volume, often called Output Rate, is a fundamental metric that measures the total quantity of goods produced over a specific period. It’s the ultimate measure of throughput, providing a clear, high-level view of your factory's capacity and ability to meet demand. This KPI directly answers the question: "Are we producing enough to meet our schedule?"
A consistently low production volume signals critical issues like equipment bottlenecks, inefficient workflows, or supply chain disruptions. Tracking this KPI is essential for aligning production capacity with sales forecasts and ensuring you can deliver on customer promises.
Why Production Volume is a Game-Changer
Production Volume translates your operational efforts into a simple, powerful number that everyone understands. It provides an immediate baseline for performance and is crucial for capacity planning and resource allocation. For example, custom woodworking shops use this metric to track the number of cabinets or components completed per shift, allowing them to accurately forecast project timelines and manage client expectations.
By monitoring output rate, you can quickly identify performance dips and address them before they derail your entire production schedule, making it one of the most direct key performance indicators for production managers.
How to Measure and Improve Production Volume
The formula is a direct count of output against time: Production Volume = Total Units Produced / Time Period.
- Hourly/Shift Output:
Total good units produced in a shift / Total hours in a shift - Daily Output:
Total good units produced in a day - Weekly/Monthly Output: Tracks larger trends and is used for strategic planning.
Actionable Tip: Don't just track the final output number. Correlate production volume with quality metrics like the First Pass Yield (FPY). Pushing for higher volume at the expense of quality will only lead to increased rework, waste, and customer dissatisfaction.
To improve your output rate, start by establishing realistic targets based on historical data and machine capacity. Use visual dashboards on the shop floor to display real-time production counts against targets, creating a sense of urgency and shared purpose. When you see significant deviations, investigate immediately. Is it a machine issue? A material shortage? An operator training gap? Addressing these root causes is key to sustainable improvement.
Platforms like TimberCloud are invaluable for tracking production volume automatically. By digitizing work orders and cut lists, you get real-time visibility into every part's progress, from the CNC machine to the assembly station. This eliminates manual counting and provides accurate, up-to-the-minute data to make informed decisions. Learn more about how TimberCloud's production tracking features can help you master your output rate.
3. Defect Rate / Quality Rate
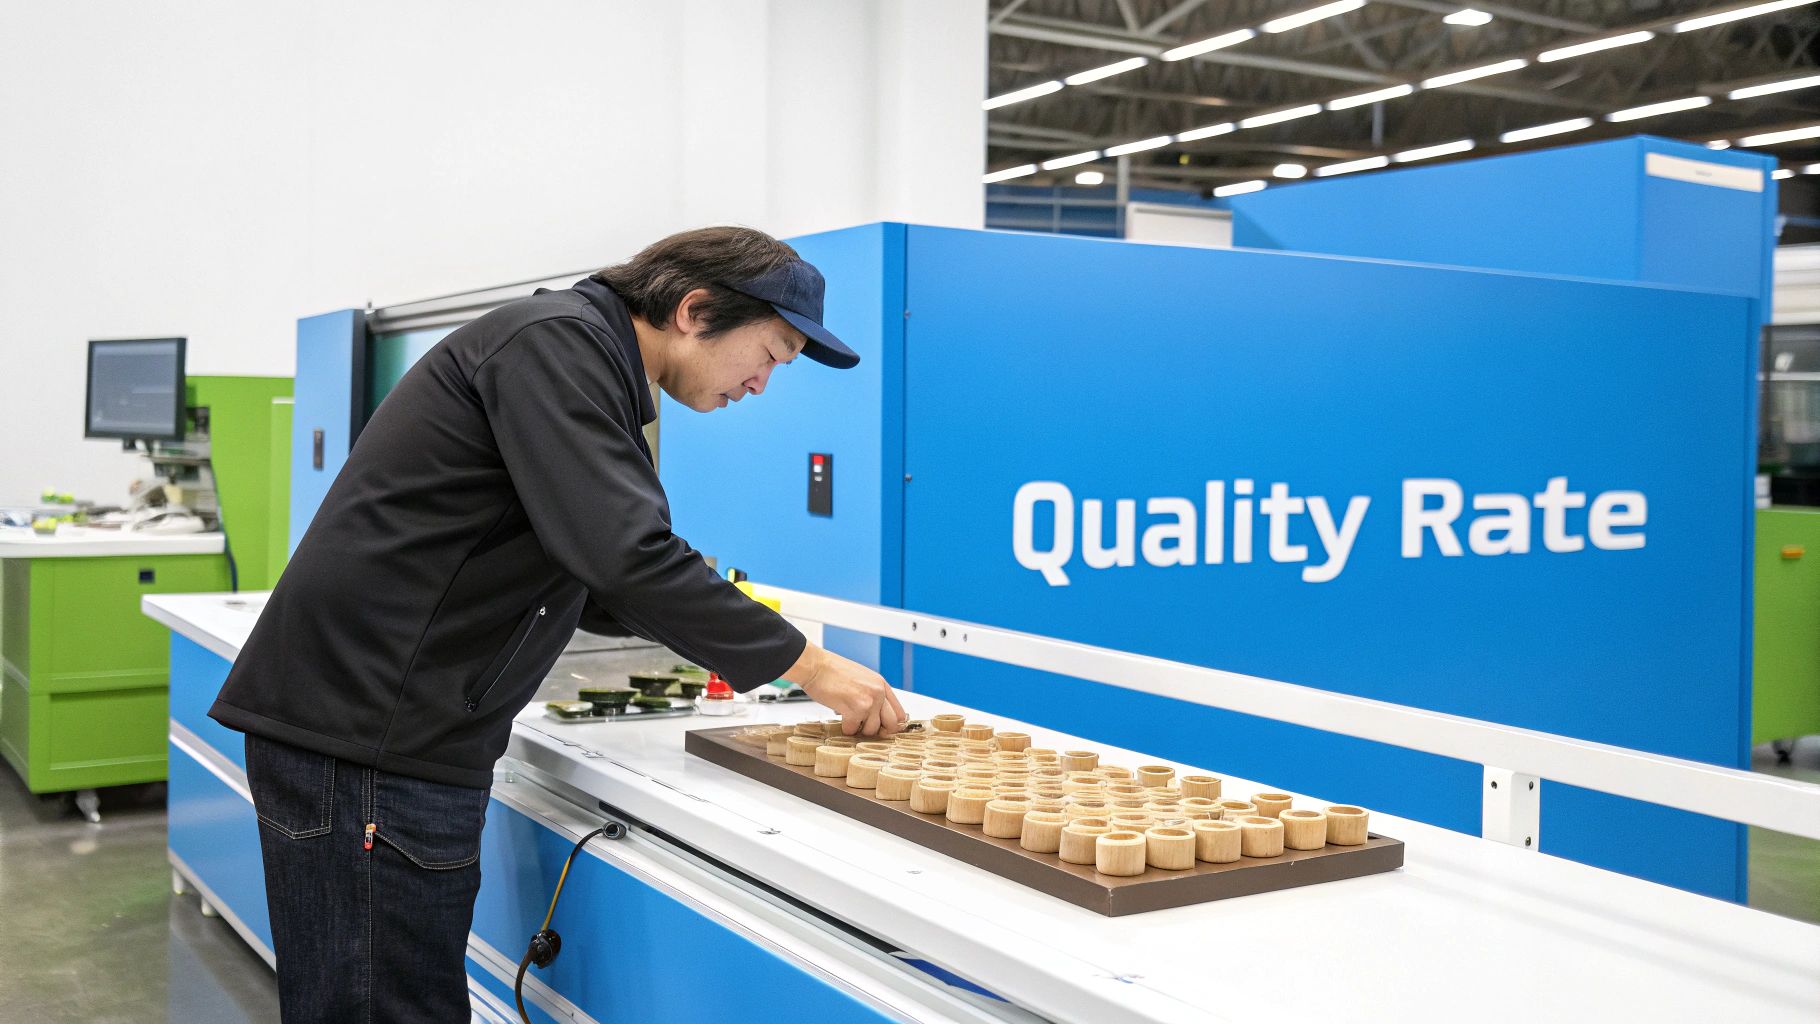
The Defect Rate, often expressed inversely as Quality Rate, is a fundamental measure of production quality. It calculates the percentage of products that fail to meet specifications relative to the total number of units produced. This KPI is a direct reflection of your process control, material quality, and operational discipline, making it an indispensable metric for any production manager committed to excellence and customer satisfaction.
A high defect rate is more than just a number; it represents wasted materials, lost labor, and potential damage to your reputation. Tracking it diligently allows you to pinpoint systemic issues, reduce costly rework, and ensure that only top-quality products leave your facility.
Why Quality Rate is a Game-Changer
Monitoring your Quality Rate moves your operation from a reactive "fix-it-when-it-breaks" model to a proactive "prevent-the-problem" culture. It provides clear, objective feedback on the health of your production processes. Industry leaders like GE, through its Six Sigma initiatives, aim for near-perfection with a target of just 3.4 defects per million opportunities. This relentless focus on quality is what separates market leaders from the rest, turning consistency into a powerful competitive advantage.
How to Measure and Improve Quality Rate
The formula is simple and direct: Quality Rate = (Number of Good Units / Total Units Produced) × 100%. The inverse, Defect Rate, is
(Number of Defective Units / Total Units Produced) × 100%- Number of Good Units: The count of finished products that pass all quality checks.
- Total Units Produced: The total number of units started and completed in a given period.
- Defective Units: Products that are scrapped, reworked, or rejected.
Actionable Tip: Don't just count defects; classify them. Create categories like "material flaw," "machining error," or "assembly mistake." This allows you to identify trends and focus your root cause analysis on the most frequent or costly problems.
Improving your Quality Rate requires engaging your entire team. Operators on the shop floor are your first line of defense; empower them to flag potential issues before they become major defects. Implement Statistical Process Control (SPC) charts to monitor process stability in real time and conduct thorough root cause analysis for any significant quality deviation.
TimberCloud's platform provides the part-level traceability needed to effectively track and reduce defects. By linking every component back to its original work order and machine process, you can quickly identify where and why failures are occurring. Discover how better production visibility can elevate your standards on the TimberCloud blog.
4. Equipment Downtime / Availability Rate
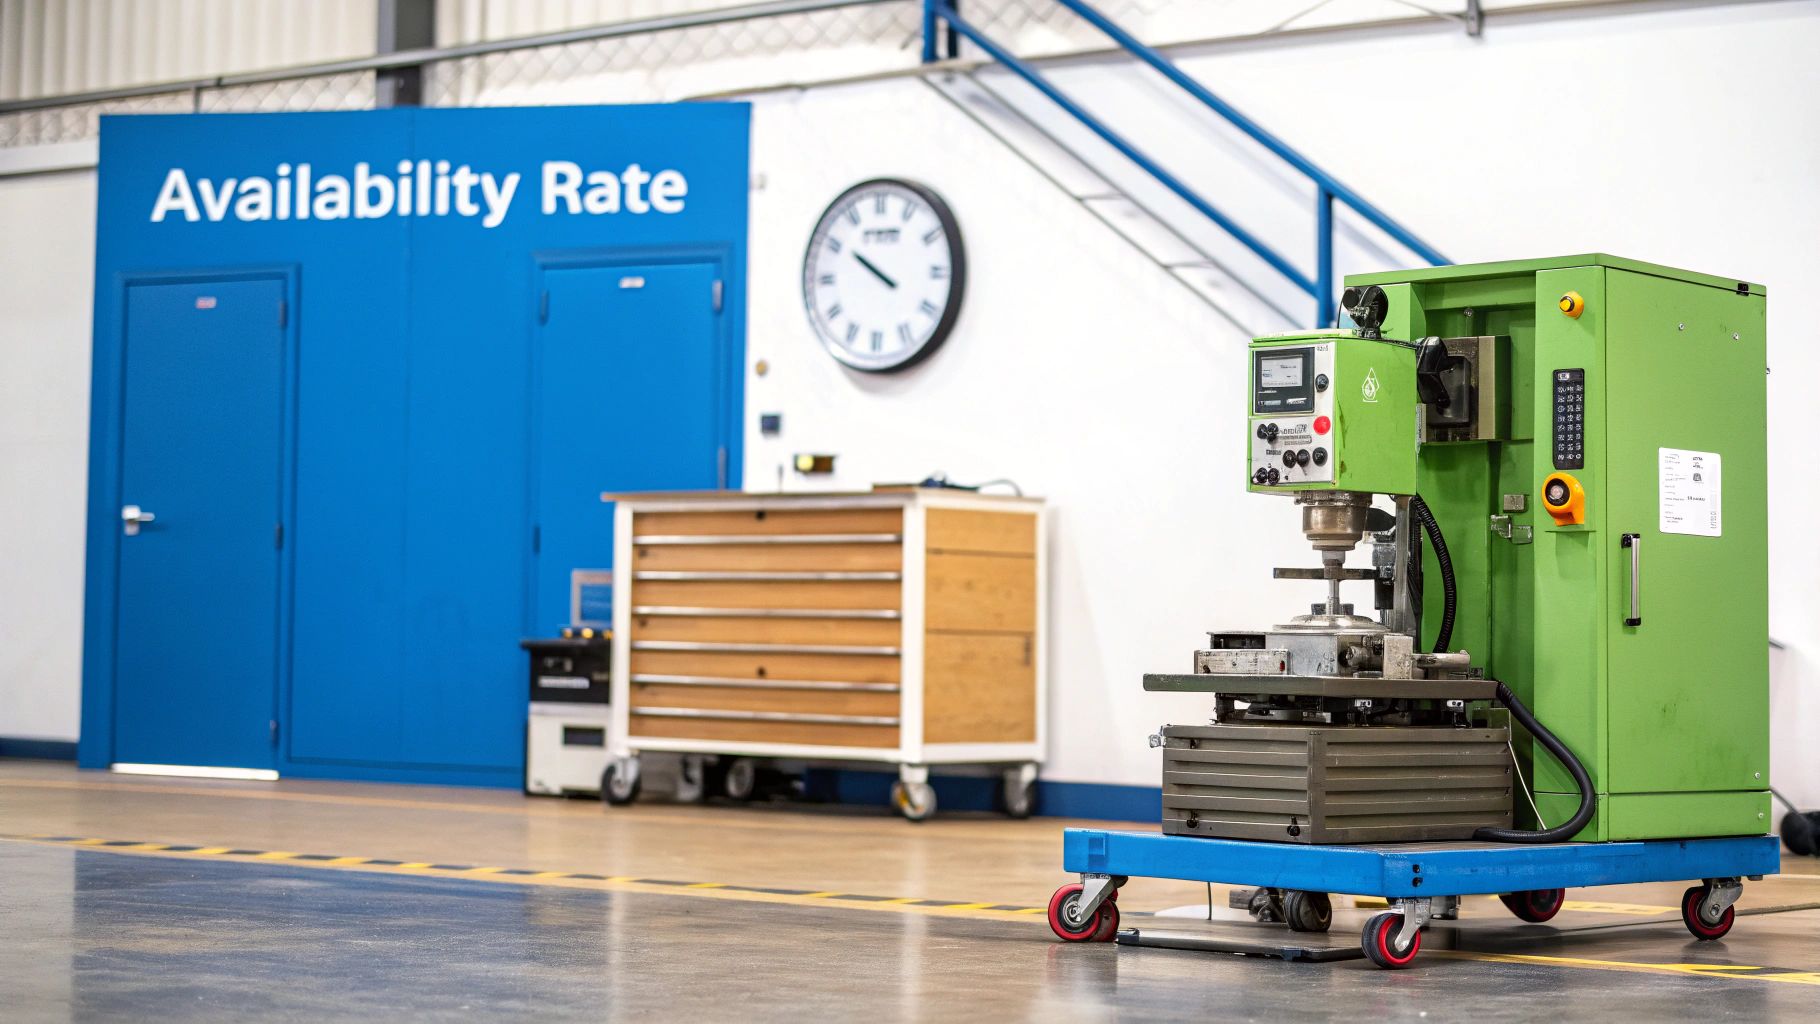
Equipment Downtime, often expressed as its inverse, Availability Rate, is a foundational KPI that measures the percentage of time machinery is operational and ready to produce against its planned production schedule. This metric directly impacts your production capacity, revealing how much potential output is lost to scheduled maintenance, unexpected breakdowns, and lengthy changeovers. For any production manager, minimizing downtime is a direct lever for increasing throughput and profitability.
A high availability rate signifies a reliable and well-maintained production environment, while a low rate exposes underlying issues in maintenance routines, operator training, or equipment health. This makes it one of the most critical key performance indicators for production managers aiming to build a resilient and efficient operation.
Why Availability Rate is a Game-Changer
Tracking availability transforms maintenance from a reactive cost center into a proactive, value-driving function. It provides clear, quantifiable data to justify investments in better equipment, spare parts inventory, and advanced maintenance strategies. World-class automotive plants, for instance, target availability rates of 95% or higher to sustain their lean production systems. Similarly, semiconductor fabs rely on meticulous availability tracking to manage their incredibly capital-intensive machinery.
Focusing on this metric forces you to understand the "why" behind every stoppage, creating opportunities for continuous improvement that directly boost your bottom line.
How to Measure and Improve Availability Rate
The calculation is direct and insightful: Availability Rate = (Planned Production Time - Downtime) / Planned Production Time.
- Planned Production Time: The total time the equipment is scheduled for operation.
- Downtime: Any period within the planned time that the equipment is not running (includes both planned and unplanned stops).
Actionable Tip: Start by categorizing every downtime event. Was it a mechanical failure, an electrical issue, a tool changeover, or a lack of materials? Use a simple Pareto chart to identify the top 2-3 reasons for downtime and focus your problem-solving efforts there for maximum impact.
To improve availability, a structured maintenance program is non-negotiable. Track both Mean Time Between Failures (MTBF) and Mean Time To Repair (MTTR) to understand not just how often machines fail, but how quickly you can get them back online. To minimize equipment downtime and maximize availability, production managers are increasingly turning to advanced tools such as predictive maintenance applications that use data to forecast failures before they happen.
TimberCloud's platform makes it easy to track downtime automatically by logging machine status in real-time. You can configure reason codes directly in the system, allowing operators to categorize stops with a single click. This provides the granular data needed to build an effective preventive maintenance schedule and keep your availability rate soaring.
5. On-Time Delivery (OTD) Rate
On-Time Delivery (OTD) Rate measures the percentage of orders delivered to the customer by the promised date. While many production metrics focus inward on shop floor efficiency, OTD is an externally-facing KPI that directly gauges your ability to meet customer promises. It connects every part of your production process, from order entry to final shipment, to the ultimate goal: customer satisfaction and loyalty.
A low OTD rate is a clear signal of underlying issues like poor production planning, supply chain disruptions, or capacity bottlenecks. It directly impacts customer retention and can damage your brand's reputation, making it one of the most critical key performance indicators for production managers to monitor.
Why OTD is a Game-Changer
OTD transforms production output from a simple measure of volume into a measure of reliability. It provides a clear, customer-centric benchmark that aligns your entire operation, from sales to shipping, around a common objective. Companies like Amazon and Toyota have built their empires on exceptional OTD rates, understanding that reliability is a powerful competitive advantage. By prioritizing OTD, you shift from just making products to building trust with every order.
How to Measure and Improve OTD
The formula is a direct reflection of your commitment to customers: OTD Rate = (Orders Delivered On Time / Total Orders Shipped) × 100%.
- Orders Delivered On Time: The number of orders that reached the customer on or before the agreed-upon delivery date.
- Total Orders Shipped: The total number of orders shipped within the same period.
Actionable Tip: Don't just track the final percentage; track the reasons for late deliveries. Create categories like "material shortage," "machine downtime," or "shipping delay." Analyzing this data reveals the root causes of your delivery failures, allowing you to focus improvement efforts where they will have the most significant impact.
Improving your OTD rate requires a proactive and holistic approach. Use demand forecasting to align production schedules with customer requirements and build strategic buffer inventory for high-variability components. Implement visual scheduling systems, such as Gantt charts or Heijunka boards, to provide real-time visibility into order progress and identify potential delays before they happen. Establish early warning systems that flag at-risk orders, giving your team time to intervene.
Platforms like TimberCloud are vital for the end-to-end visibility needed to master OTD. By integrating order management with real-time production tracking, you can accurately predict completion dates and communicate proactively with customers. Learn more about how TimberCloud's platform can streamline your workflow to ensure you hit your delivery targets.
6. Labor Productivity / Output Per Labor Hour
Labor Productivity, often measured as Output Per Labor Hour, is a fundamental metric that quantifies the efficiency of your workforce. It directly measures the amount of output (units, board feet, or revenue) generated for every hour of labor invested. This KPI is essential for understanding your labor cost-effectiveness and pinpointing opportunities for process improvements, automation, or targeted employee training.
A declining productivity score is a critical warning sign. It could indicate process bottlenecks, insufficient training, equipment issues, or even low morale. By tracking this KPI, you can address these problems proactively before they significantly impact your bottom line, making it one of the most crucial key performance indicators for production managers.
Why Labor Productivity is a Game-Changer
This metric moves the conversation from simply managing labor costs to optimizing labor value. It provides a clear, objective measure of how well your team is converting their time and effort into finished products. In custom woodworking and manufacturing, where labor is often the largest variable cost, even minor improvements in productivity can lead to substantial gains in profitability.
It helps answer key questions: Are your new training programs working? Does a new piece of equipment justify its cost? Is a particular shift consistently outperforming others? By tracking this, you can make data-driven decisions that empower your team and streamline operations.
How to Measure and Improve Labor Productivity
The formula is a straightforward ratio: Labor Productivity = Total Output / Total Labor Hours.
- Total Output: The number of good units produced, total board feet processed, or total revenue generated in a specific period.
- Total Labor Hours: The sum of all hours worked by direct and indirect labor involved in production during that period.
Actionable Tip: Don't just focus on the overall number. Segment your productivity data by team, shift, or even specific work cells. This granular view helps you identify high-performing pockets within your operation and replicate their successful processes elsewhere.
Improving labor productivity requires a holistic approach. Ensure your team has the right tools, clear instructions, and a well-organized workspace to minimize wasted motion and effort. Hold brief daily stand-up meetings to discuss targets and address any immediate obstacles. Importantly, balance productivity goals with quality and safety metrics to foster a sustainable, high-performance culture.
Platforms like TimberCloud are crucial for accurately capturing the data needed for this KPI. By linking production output directly to employee time tracking, you can automate calculations and gain real-time visibility into workforce efficiency. Explore how TimberCloud's production tracking features can help you monitor and enhance labor productivity.
7. First Pass Yield (FPY) / First Time Through (FTT)
First Pass Yield (FPY), also known as First Time Through (FTT), is a ruthless yet vital quality metric. It measures the percentage of products that are manufactured to specification and pass inspection on the very first attempt, without any need for rework, repair, or scrap. This KPI directly reflects the capability and stability of your production process, showing how efficiently you can produce quality parts from the start.
A low FPY score is a red flag, indicating hidden costs and inefficiencies eating into your profits. It reveals waste in the form of extra labor for rework, wasted materials, and additional inspection time, making it one of the most important key performance indicators for production managers focused on profitability and process control.
Why FPY is a Game-Changer
FPY exposes the "hidden factory" within your operations – the portion of your capacity dedicated to fixing mistakes instead of creating value. Improving FPY directly boosts throughput, reduces lead times, and lowers the cost of quality. Companies in high-precision industries like medical device manufacturing and electronics have seen significant profit gains by focusing on FPY, as it forces a culture of getting things right the first time.
How to Measure and Improve FPY
The formula is a straightforward measure of perfection: FPY = (Units Completed Correctly the First Time / Total Units Entering the Process) × 100%.
- Units Completed Correctly: The number of units that pass inspection without any rework.
- Total Units Entering: The total number of units that began the process step.
- Rolled Throughput Yield (RTY): For a multi-step process, you can multiply the FPY of each step to get the RTY, which shows the probability a unit passes through the entire process defect-free.
Actionable Tip: Don't get overwhelmed by tracking every process at once. Start by measuring FPY at your final inspection point to get a baseline. Then, use a Pareto chart to identify which upstream process or work cell is responsible for the majority of defects and focus your improvement efforts there.
Improving FPY means preventing defects, not just catching them. Implement mistake-proofing (Poka-Yoke) techniques at the source, such as using jigs or fixtures that prevent incorrect assembly. Train operators thoroughly on quality standards and empower them to identify potential defects early. By calculating the total cost impact of rework, you can build a powerful business case to justify investments in process improvement initiatives.
TimberCloud provides the detailed work order tracking necessary to calculate FPY accurately. By logging every unit's journey, including rework loops, you can pinpoint exactly where defects occur and measure the impact of your improvements. Find out how TimberCloud's platform can bring this level of quality control to your shop floor.
8. Cycle Time / Lead Time
Cycle Time and Lead Time are fundamental metrics that measure the speed and responsiveness of your entire production process. Cycle Time is the actual time it takes to complete one unit of a product from start to finish. In contrast, Lead Time is the total time from when an order is received until it is delivered, including all waiting periods, queues, and non-value-added delays. These metrics are essential for accurate production planning, capacity analysis, and improving customer satisfaction.
A long lead time can signal inefficiencies like bottlenecks, poor scheduling, or excessive inventory, directly impacting your ability to meet customer deadlines. By distinguishing between the two, you can pinpoint whether delays are happening during active production (Cycle Time) or in the gaps between processes (Lead Time).
Why Cycle Time / Lead Time is a Game-Changer
These metrics directly translate to your company's agility and competitiveness. Reducing cycle and lead times allows you to increase throughput, reduce work-in-process (WIP) inventory, and provide more accurate delivery estimates to customers. Toyota’s Just-in-Time (JIT) system is built on the relentless pursuit of shorter lead times, eliminating waste and improving cash flow. Focusing on these times shifts your operational mindset from simply managing tasks to optimizing the entire value stream.
How to Measure and Improve Cycle Time / Lead Time
The formulas are distinct yet interconnected:
- Cycle Time: The average time to produce one unit. Calculated as .
Net Production Time / Number of Units Produced - Lead Time: The total time from order to delivery. Calculated as .
Time of Delivery - Time of Order
Actionable Tip: Don't treat all time as equal. Use value stream mapping to visually separate value-added processing time from non-value-added waiting time. This will immediately highlight your biggest opportunities, such as excessive queuing before a bottleneck machine.
Improving these metrics requires a focus on flow. Analyze your bottleneck operations first, as any improvement there will impact the entire system. Implement strategies like batch size reduction to decrease the time products spend waiting in queues. Critically, use the data to communicate realistic lead times to your sales team and customers, which builds trust and manages expectations effectively.
Platforms like TimberCloud provide the end-to-end visibility needed to track orders from placement to completion. By automatically logging when a job enters and leaves each production stage, you can get precise, real-time data on both cycle and lead times without manual data entry. Learn more about how TimberCloud's production tracking features can help you identify and eliminate costly delays.
9. Changeover Time (SMED - Single Minute Exchange of Dies)
Changeover Time measures the total duration required to switch a production line or machine from making one product to another. It's a critical metric for agility, covering everything from tooling changes and setup to calibration and first-piece inspection. This KPI is directly targeted by the Single-Minute Exchange of Dies (SMED) methodology, which aims to reduce this non-productive time to under 10 minutes, making it one of the most impactful key performance indicators for production managers focused on flexibility.

Long changeovers force you into large batch sizes to minimize setup frequency, which ties up capital in inventory and reduces your ability to respond to customer demand. A low changeover time, however, unlocks the ability to produce smaller, more diverse batches profitably, transforming your shop into a highly responsive and lean operation.
Why Changeover Time is a Game-Changer
Mastering changeover time is the key to unlocking true production flexibility. It directly attacks hidden factory waste by converting downtime into valuable production time. The legendary Toyota Production System built its "just-in-time" model on the back of SMED, enabling them to adapt to market shifts with incredible speed. In custom woodworking and millwork, where product variation is the norm, fast changeovers are not just a nice-to-have; they are a competitive necessity.
How to Measure and Improve Changeover Time
The formula is a direct time measurement: Changeover Time = Time of Last Good Part (Previous Run) to Time of First Good Part (New Run).
The core of improvement lies in the SMED methodology, pioneered by Shigeo Shingo.
- Analyze the Process: Videotape your current changeover process and break it down into every single step.
- Separate Internal and External Activities: Identify tasks that must be done while the machine is stopped (internal) versus those that can be prepared beforehand or done after (external).
- Convert Internal to External: The primary goal is to shift as many internal steps as possible to external ones. This includes pre-positioning tools, materials, and jigs before the machine ever stops.
- Streamline Remaining Steps: For the internal tasks that remain, use quick-release clamps, standardized tooling, and visual work instructions to minimize time.
Actionable Tip: Don't aim for perfection on the first try. Start by converting just one or two internal activities into external ones. For example, have the next set of CNC bits or raw materials staged and ready right beside the machine before the current job finishes. This small win builds momentum.
Engage your machine operators in this process; they are the experts who will identify the biggest opportunities for time savings. Regular practice sessions, like a pit crew, and celebrating every second saved will embed a culture of speed and efficiency in your team.
10. Overall Line Effectiveness (OLE) / Overall Process Effectiveness (OPE)
While OEE provides a laser focus on individual machines, Overall Line Effectiveness (OLE) zooms out to measure the productivity of an entire production line or process. It’s a comprehensive metric that combines equipment effectiveness with material utilization and labor productivity, offering a true system-level view. This holistic approach prevents you from optimizing one machine only to create a bottleneck elsewhere, making it one of the most strategic key performance indicators for production managers.
A low OLE score reveals systemic inefficiencies that single-machine metrics might miss. It forces you to analyze the interplay between your equipment, materials, and people, identifying constraints that limit total output.
Why OLE is a Game-Changer
OLE shifts the focus from isolated efficiency to integrated system performance. It provides a more accurate picture of your capacity to meet customer demand by accounting for all major production inputs. Companies in sectors like automotive and electronics use OLE to benchmark entire lines, compare performance across shifts, and pinpoint which part of the system (machines, materials, or methods) offers the biggest opportunity for improvement. Adopting OLE moves your team from fixing individual problems to optimizing the entire value stream.
How to Measure and Improve OLE
The formula expands on OEE: OLE = OEE × Material Yield × Labor Productivity.
- OEE: The standard measure of equipment effectiveness (Availability × Performance × Quality) for the entire line.
- Material Yield: Measures material waste. Calculated as .
Good Units Produced / Theoretical Maximum Units from Material Input - Labor Productivity: Measures human efficiency. Calculated as .
(Standard Labor Hours for Good Units) / Actual Labor Hours Worked
Actionable Tip: Don't get overwhelmed by the complexity. Start by mastering OEE for your bottleneck machine, then gradually expand your measurement to include the entire line. Once you have a stable line OEE, introduce the Material Yield component, as material costs are often a significant factor in custom manufacturing.
To improve OLE, engage line leaders and cross-functional teams in reviewing the data. Use Pareto analysis to identify whether the primary losses stem from equipment downtime, material defects, or labor inefficiencies. Break down OLE by shift or product run to uncover specific patterns and focus your improvement efforts where they will have the greatest impact on overall business results.
Platforms like TimberCloud are vital for capturing the diverse data streams needed for OLE. By integrating machine data with production schedules and material usage, you can automate the calculation and gain a clear, real-time view of your entire line's performance. Explore how TimberCloud's comprehensive tracking can help you move beyond OEE to master OLE.
Top 10 Production KPI Comparison
| Metric | Implementation Complexity 🔄 | Resource Requirements ⚡ | Expected Outcomes ⭐📊 | Ideal Use Cases 💡 | Key Advantages ⭐ |
|---|---|---|---|---|---|
| Overall Equipment Effectiveness (OEE) | High — integrated data & calculations | High — MES/SCADA, sensors, analysts | Holistic equipment % with benchmarking | Multi-equipment plants; CI/TPM programs | Combines availability, performance, quality |
| Production Volume / Output Rate | Low — simple count-based setup | Low — counters or basic MES/dashboard | Total units produced; capacity visibility | High-volume operations; revenue tracking | Easy to measure and communicate |
| Defect Rate / Quality Rate | Medium — inspection systems & sampling | Medium — QC tools, inspectors, automation | % defective; reduces returns/warranty costs | Regulated or quality-critical industries | Direct link to customer satisfaction |
| Equipment Downtime / Availability Rate | Medium — time-tracking & reason codes | Medium — sensors, CMMS/MES integration | % availability; highlights reliability gaps | Equipment-intensive plants; maintenance focus | Drives preventive/predictive maintenance |
| On-Time Delivery (OTD) Rate | Medium — cross-system integration (ERP/WMS/TMS) | Medium–High — planning & logistics systems | % orders on promise date; customer indicator | Customer-facing supply chains; distribution | Connects production to customer performance |
| Labor Productivity / Output Per Labor Hour | Low–Medium — labor hour tracking | Low — timekeeping, payroll, basic analytics | Units per labor hour; cost-efficiency insight | Labor-intensive operations; staffing decisions | Highlights training needs and automation ROI |
| First Pass Yield (FPY) / First Time Through | High — full traceability across steps | Medium–High — SPC, traceability, documentation | % without rework; reveals true waste cost | High-rework-cost industries (semiconductor, medical) | Measures process capability; reduces rework |
| Cycle Time / Lead Time | Low–Medium — time studies & data capture | Low — tracking tools, mapping workshops | Shorter cycle/lead times; faster responsiveness | JIT, make-to-order, flow optimization | Identifies bottlenecks; lowers inventory need |
| Changeover Time (SMED) | Medium — analysis, standardization & practice | Medium — quick-change tooling, training | Reduced setup time; smaller batches possible | High-mix / low-volume production lines | Enables flexibility and lower inventory |
| Overall Line Effectiveness (OLE) / OPE | Very High — integrates multiple domains | High — MES + ERP + cross-functional data | Holistic line % prioritizing balanced gains | Line-level benchmarking; multi-factor improvements | More complete than OEE; balances equipment/material/labor |
Turning Data into Decisive Action
Navigating the complexities of modern woodworking and custom manufacturing requires more than just intuition and experience. It demands a data-driven mindset, a commitment to continuous improvement, and a clear understanding of the metrics that truly matter. The ten key performance indicators for production managers detailed in this article, from Overall Equipment Effectiveness (OEE) to On-Time Delivery (OTD), are not just abstract numbers on a spreadsheet. They are the vital signs of your operation, the language your shop floor uses to tell you what's working and where it needs help.
Mastering these KPIs is the first, crucial step. The real transformation, however, begins when you move beyond simple understanding and into the realm of consistent, actionable analysis. Each metric, whether it's First Pass Yield or Cycle Time, offers a diagnostic tool. A falling OEE score isn't just a problem; it's a specific signal pointing toward excessive downtime, reduced performance, or quality issues that need immediate attention. A low On-Time Delivery rate is a direct reflection of bottlenecks, inefficient scheduling, or supply chain friction.
From Measurement to Mastery
The journey from tracking metrics to achieving operational excellence involves a fundamental shift in perspective. Instead of viewing KPIs as a way to grade past performance, you must see them as a roadmap for the future. This is where the power of integrated systems becomes undeniable.
- Move Beyond Manual Tracking: Relying on manual data entry, paper logs, and disparate spreadsheets is a recipe for delays, inaccuracies, and missed opportunities. It creates a reactive environment where you're always playing catch-up.
- Embrace a Single Source of Truth: A unified platform automates data collection directly from your machines and processes. This ensures the data you're analyzing is accurate, real-time, and comprehensive, providing a trustworthy foundation for critical decisions.
- Visualize Your Performance: Raw data can be overwhelming. Effective dashboards and visual reports translate complex numbers into clear, intuitive insights. This allows you and your team to spot trends, identify anomalies, and understand performance at a glance.
By connecting every stage of your operation, from the initial customer order on your e-commerce platform to the final product leaving the shop floor, you create a seamless flow of information. This alignment ensures that your production targets are not just internal goals but are directly tied to customer promises and business objectives.
Key Takeaway: The ultimate value of these key performance indicators for production managers lies not in the numbers themselves, but in the conversations they start, the questions they provoke, and the targeted improvements they inspire. They empower you to stop guessing and start managing with surgical precision.
Redefining Your Production Potential
Ultimately, the goal is to build a culture of data-informed decision-making. When your entire team understands the "why" behind metrics like Changeover Time and Labor Productivity, they become active participants in the improvement process. They can identify small, incremental changes that, over time, lead to monumental gains in efficiency, quality, and profitability.
Stop letting valuable operational data slip through the cracks. Embrace the power of these KPIs to unlock new levels of performance, drive sustainable growth, and build a more resilient, competitive, and successful manufacturing business. The tools and the data are available; the decisive action starts with you.
Ready to transform your production data into your most powerful asset? See how TimberCloud, Inc. provides an integrated platform that automates the tracking of these critical KPIs, connecting your e-commerce storefront directly to your shop floor for unparalleled visibility and control. Visit us at TimberCloud, Inc. to schedule a demo and start your journey toward operational excellence.
Frequently asked questions
Manufacturing KPIs are measurable values — such as OEE, defect rate, and on-time delivery — that show how production is performing against targets. They replace gut feel with numbers a manager can act on.
The five most widely tracked are OEE, on-time delivery rate, defect or quality rate, production volume, and equipment downtime. Together they cover equipment, quality, throughput, and customer commitments — the four things a shop lives or dies by.
Discrete manufacturers average about 66.8% OEE, and 85% or higher is considered world class. For a custom shop, moving from 60% toward 75% usually matters more than chasing 85 — each point is capacity you have already paid for.
Cycle time is how long it takes to produce one unit once work actually starts. Lead time is the total elapsed time from order to delivery, including queues and waiting. A long lead time paired with a short cycle time means jobs are sitting, not being cut.
Start with three metrics you can pull weekly from records you already keep: on-time delivery, defect or rework rate, and output per labor hour. Once the habit sticks, shop-management software can automate the rest and add the equipment-level metrics.
Topics
TimberCloud Team
Content Team
The TimberCloud team is dedicated to helping manufacturers streamline their operations with intelligent software solutions.