A Guide to Manufacturing Forecasting Software
Trying to run a modern manufacturing operation on spreadsheets is like navigating a city with a folded paper map—you’ll eventually get tangled in stockouts, excess inventory, and chaotic schedules. Think of manufacturing forecasting software as your factory’s real-time GPS. It takes all your operational data and turns it into reliable predictions that guide everything from purchasing and production to strategic planning. It gives you a clear, data-backed path forward.
Why Spreadsheets Are Holding Your Factory Back
For a long time, spreadsheets were the default planning tool. They're familiar and seem easy enough to use, but in today's demanding market, their limitations have become a major liability. Sticking with manual data entry and disconnected files is a recipe for costly mistakes, siloed information, and a business that's always reacting instead of planning ahead.
When your team is burning hours manually updating complex formulas and trying to figure out which version of a file is the "right" one, they aren't focused on strategy. This constant manual grind isn't just inefficient; it's a direct threat to your bottom line and your ability to keep up with the competition.
The Real Costs of Manual Forecasting
The cracks in a spreadsheet-based system quickly turn into chasms, causing very real setbacks for the business. These problems often trigger a domino effect, impacting everything from cash flow to customer loyalty.
You've likely felt these pain points firsthand:
- Frequent Stockouts: Underestimate the demand for just one critical component, and an entire production line can grind to a halt. The result? Missed deadlines and unhappy customers.
- Excess Inventory: Overestimate future sales, and you’ve tied up precious cash in raw materials that just sit on warehouse shelves, driving up carrying costs and waste.
- Inaccurate Scheduling: Without a clear picture of future demand and your true capacity, production scheduling becomes a guessing game, leading to last-minute overtime and expensive machinery sitting idle.
- Poor Decision-Making: When your strategies are built on outdated or flat-out wrong data, you can't adapt to market shifts or unexpected supply chain disruptions.
Manual forecasting traps you in a constant cycle of firefighting. Instead of proactively shaping your operations, you're always reacting to emergencies caused by bad predictions and a total lack of real-time insight.
Let's quickly compare the old way with the new.
Manual vs. Automated Forecasting: A Quick Comparison
This table breaks down the core differences between relying on spreadsheets and adopting a dedicated forecasting tool. It’s not just about features; it’s a fundamental shift in how you plan and operate.
| Aspect | Manual Forecasting (Spreadsheets) | Forecasting Software |
|---|---|---|
| Data Integrity | Prone to human error, version control issues, and outdated information. | Centralized, real-time data ensures everyone works from a single source of truth. |
| Efficiency | Extremely time-consuming; requires hours of manual data entry and updates. | Automates data collection and analysis, freeing up teams for strategic work. |
| Accuracy | Relies on basic formulas and gut feelings; struggles with complex variables. | Uses advanced algorithms (AI/ML) to produce highly accurate, dynamic forecasts. |
| Collaboration | Siloed information; difficult for teams to collaborate effectively. | Provides a shared platform for planning, improving communication and alignment. |
| Scalability | Becomes unmanageable and breaks as the business grows and complexity increases. | Easily scales with your operation, handling more products, suppliers, and data. |
The move away from manual methods is a clear choice for any manufacturer looking to build a more resilient and competitive business.
This widespread challenge is exactly why the industrial software market—which includes these powerful forecasting tools—is growing so fast. Valued at US$110.5 billion in 2023, it's projected to hit US$189.7 billion by 2029, as more manufacturers ditch outdated manual processes. This isn't just a trend; it's a fundamental shift toward using predictive analytics to sharpen planning and slash operational costs. You can explore more insights on this market growth at Business Wire.
Ultimately, adopting manufacturing forecasting software isn't just about getting new tech. It's about building a more agile, resilient, and profitable operation from the shop floor up.
The Three Pillars of Smart Manufacturing Forecasting
Great production planning isn’t a dark art—it’s a carefully orchestrated balancing act. It all comes down to three interconnected pillars. If one is shaky, the whole operation becomes unstable, leading to some seriously expensive disruptions. Getting a handle on these three components is your first real step toward building a manufacturing business that's both tough and efficient.
Think of your operation like a high-end restaurant. To keep the doors open and customers happy, you need to nail three things: know how many diners to expect, have the right ingredients ready to go, and be sure your kitchen can actually handle the rush. Modern manufacturing forecasting software is what pulls all of this together, making sure every part of the process is working in sync.
This is the journey most manufacturers take, trading the headaches of manual spreadsheets for the clarity that a dedicated software solution brings.
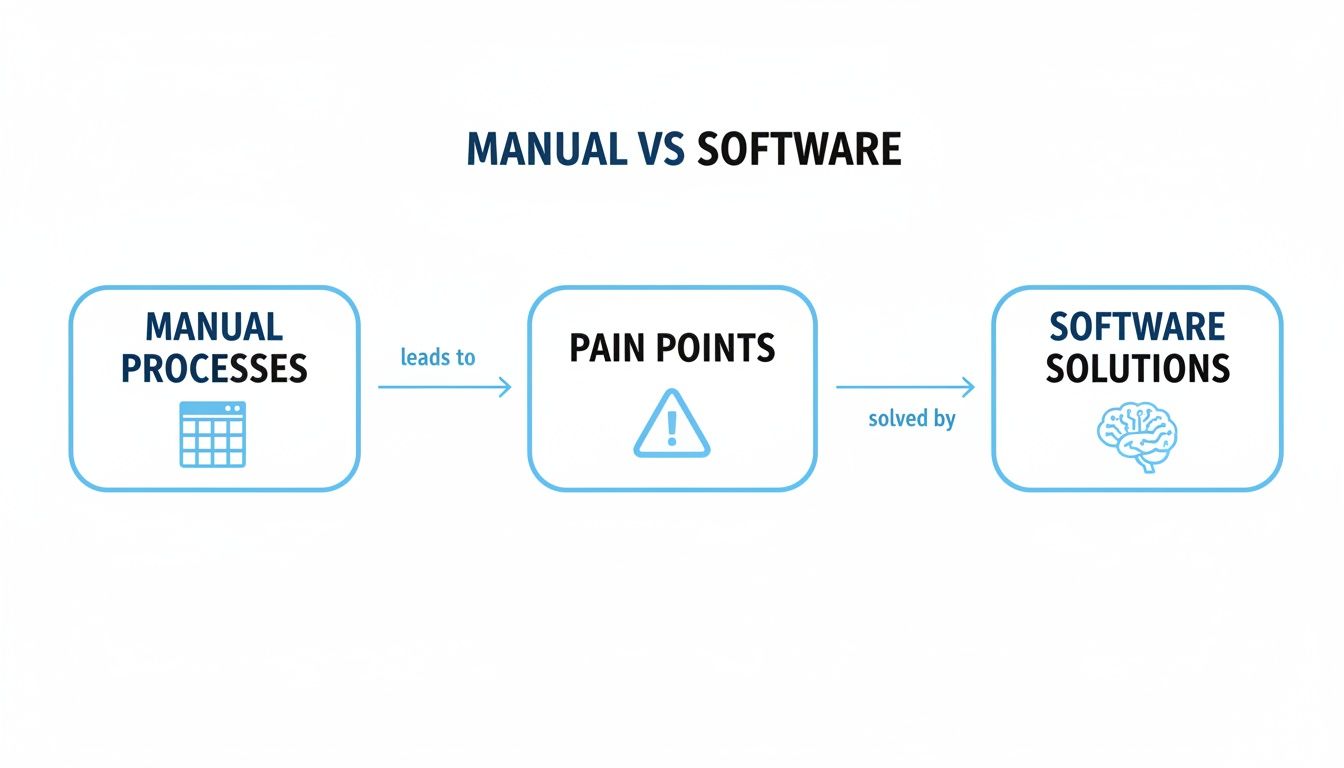
As you can see, sticking with manual methods is a recipe for operational friction. Smart software is what bridges the gap, paving the way for predictable and efficient production.
Pillar 1: Demand Forecasting
Think of demand forecasting as your sales "weather report." It's all about predicting what your customers will want to buy, how much of it, and when they'll want it. This is ground zero for all your planning—it sets the tempo for your entire operation.
Without a solid demand forecast, you're essentially flying blind. You might churn out way too much of a product that just isn't selling, locking up cash in inventory that's collecting dust. Even worse, you could completely underestimate the demand for a hot-ticket item, leading to stockouts, lost sales, and unhappy customers who will quickly look elsewhere.
A solid demand forecast is the engine of your production plan. It drives every subsequent decision, from purchasing raw materials to scheduling shifts on the shop floor. Getting it right is non-negotiable for growth.
Pillar 2: Material Forecasting
Okay, so demand forecasting tells you what to make. Material forecasting tells you what ingredients you need to buy to actually make it. This pillar is your factory’s automated shopping list. It dives into your upcoming production schedule, cross-references your current inventory, and calculates exactly which raw materials and components you need to get on order.
But it’s a bit more sophisticated than just counting parts. A good material forecast has to juggle a few key things:
- Bill of Materials (BOM): This is the exact recipe for every single product, spelling out every nut, bolt, and sub-assembly needed.
- Supplier Lead Times: You need to know how long it will take for the materials you order to actually show up at your door.
- Current Stock Levels: It checks what you already have on the shelf so you aren't wasting money buying things you don't need.
Get this part wrong, and production comes to a screeching halt. It doesn't matter if you have the orders and the staff ready to go; a single missing component can idle an entire assembly line. That means costly delays that send shockwaves through your whole schedule.
Pillar 3: Capacity Forecasting
This brings us to the final, crucial question: do you actually have the resources—people and machines—to get the job done? Capacity forecasting is about knowing if your kitchen has enough cooks and ovens to handle the dinner rush.
This pillar sizes up your production schedule against your real-world operational capacity. It's your early-warning system for bottlenecks, giving you a chance to make adjustments before things go sideways. For example, if you see a huge spike in orders on the horizon for three weeks from now, capacity forecasting helps you decide whether to schedule overtime, bring in temporary help, or maybe shift some production priorities around to hit your deadlines.
Without this foresight, you're just guessing. You end up over-promising and under-delivering, taking on orders you have no realistic shot at completing on time. That's a fast way to damage your reputation and burn out your team.
These three pillars aren't separate silos; they're completely intertwined. A bad demand forecast torpedoes your material and capacity plans from the start. A perfect material plan is worthless if you don't have the capacity to use the parts. This is where manufacturing forecasting software comes in—it’s the only way to effectively manage these dependencies and create a seamless flow from sales prediction all the way to final production.
The Core Features That Make Forecasting Software a Game-Changer
Great manufacturing forecasting software is much more than a crystal ball for sales. It's really an entire toolkit of connected features, all working together to bring clarity and control to your whole production line. These tools dig into your raw data and turn it into intelligence you can actually use. Without them, you're making educated guesses. With them, you're making strategic, data-driven decisions.
Let's pop the hood and look at the components that make this technology a true operational asset. Understanding these features will show you exactly how this software solves the real-world challenges you're facing on the shop floor every single day.
Demand Signal Analysis
At its core, any good forecasting tool has to listen to the market. Demand signal analysis is the feature that does just that, pulling in all sorts of data points to paint a realistic picture of what's coming down the pike. It’s not just about looking at last year's orders anymore.
Modern systems blend data from several places to sharpen their predictions:
- Historical Sales Data: This is your foundation, giving you a baseline of past performance.
- Seasonality and Trends: It spots those repeating patterns, like the holiday rush or the slow season.
- Market Indicators: This brings in the outside world, like economic data or industry trends that could nudge sales up or down.
- Sales & Marketing Input: The system accounts for your team's efforts, like an upcoming promotion or a newly signed customer contract.
By weaving all these signals together, the software gives you a far more nuanced—and accurate—demand forecast than you could ever get by just looking in the rearview mirror.
Bill of Materials Integration
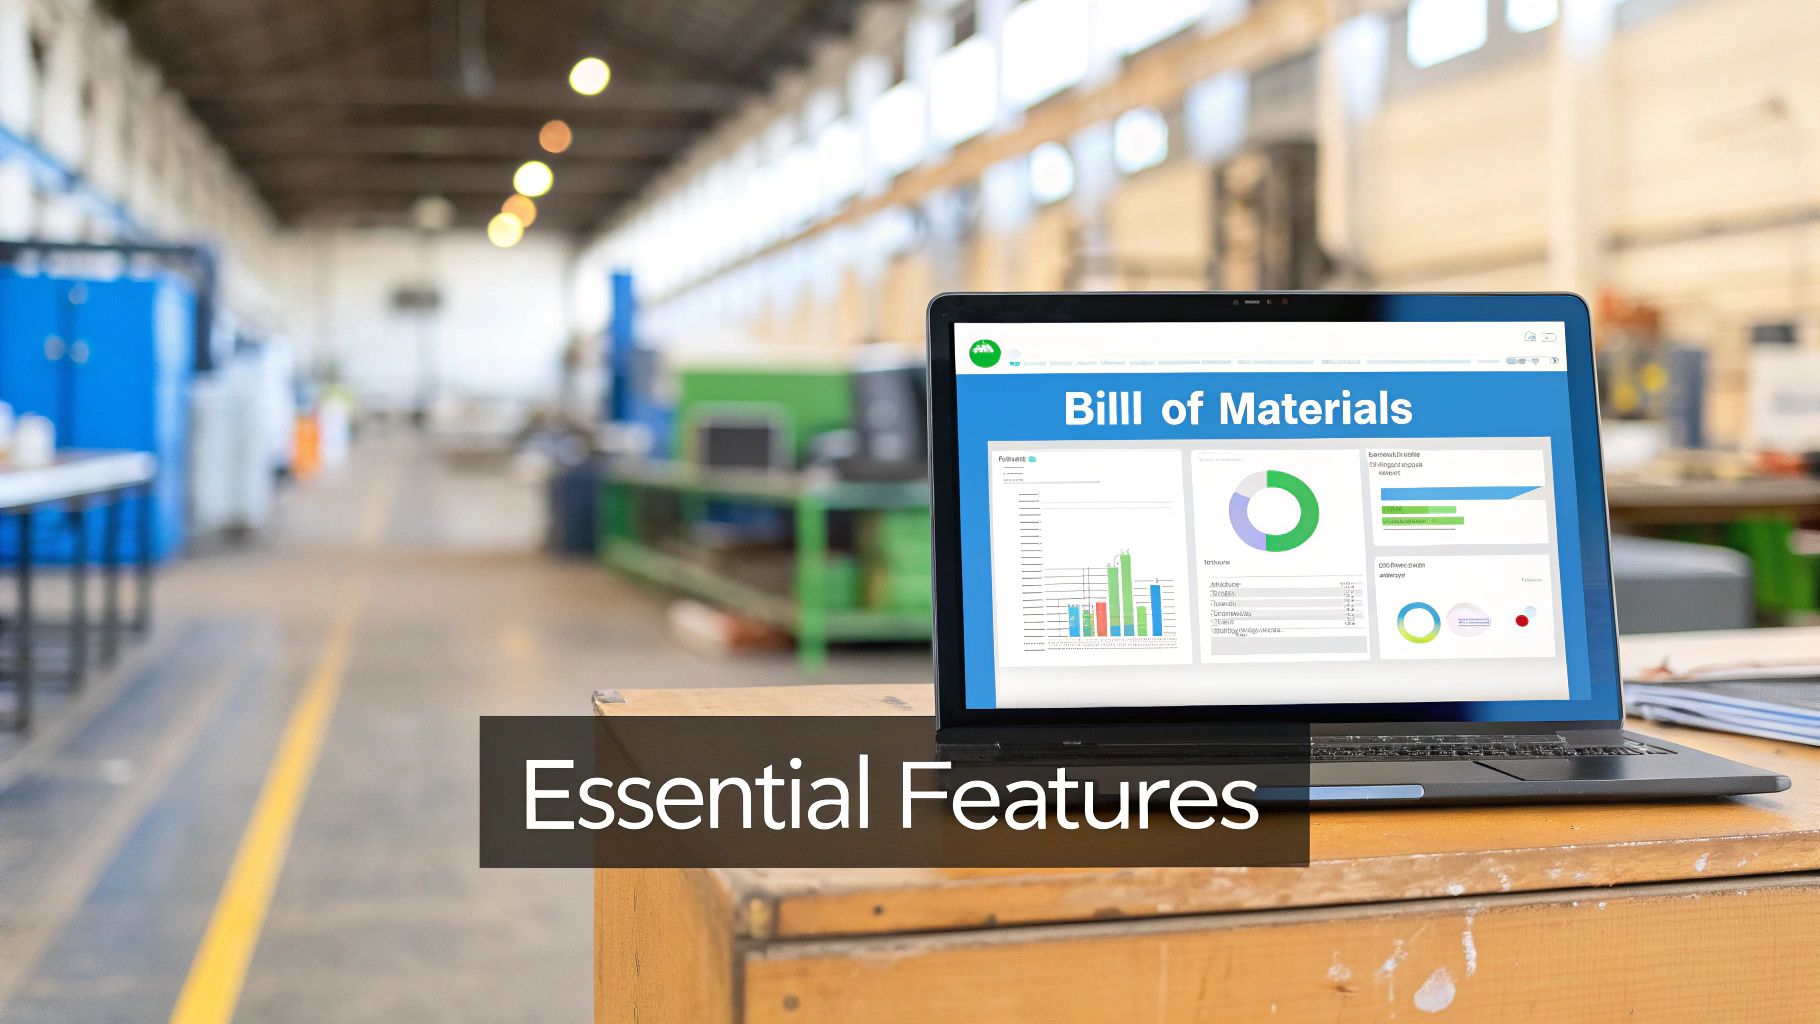
A sales forecast is just a number until you connect it to a production plan. That’s where Bill of Materials (BOM) integration becomes absolutely essential. Think of your BOM as the detailed recipe for every single product you make, listing every part, sub-assembly, and raw material needed.
When your forecasting software plugs directly into your BOMs, it does something magical. It takes the big-picture forecast for finished goods (like, "we need to build 500 custom cabinets") and instantly "explodes" it into a detailed shopping list for every component required ("so we'll need 3,000 hinges, 2,000 drawer pulls, and 1,000 sheets of plywood").
Without tight BOM integration, your material planning is flying blind, completely disconnected from your sales forecast. This is where stockouts and production delays are born, because you simply won't have the right parts on hand to build what your customers are actually ordering.
Lead Time and Safety Stock Optimization
Knowing what you need to order is only half the battle. Knowing when to order it is just as important. The software models supplier lead times—the clock that starts ticking from the moment you place an order to when the materials arrive. This ensures you send out purchase orders with enough of a cushion to keep the production lines from grinding to a halt.
Building on that is safety stock optimization. Instead of relying on an old rule of thumb, the software calculates the perfect amount of buffer inventory to keep on hand. It analyzes how much your demand fluctuates and how reliable your suppliers are to recommend a safety stock level that keeps carrying costs low while shielding you from surprise disruptions. It’s a living, breathing calculation, not some static number you set once a year. Getting this right depends on solid data management, especially for things like Time Series Data with Snowflake.
Scenario Planning and Simulation
This might be one of the most powerful strategic tools in the entire package. Think of it as a flight simulator for your supply chain. Scenario planning lets you ask "what if?" and see the probable outcome without any of the real-world risk.
You can run simulations to stress-test your operations and see where the weak points are:
- What happens if a key supplier is delayed by three weeks?
- What's the impact if demand for our top seller suddenly jumps by 40%?
- How do our margins look if the cost of a primary raw material spikes by 25%?
Running these drills lets you build contingency plans before you need them, spot bottlenecks ahead of time, and just generally make smarter decisions. It shifts your team from being reactive firefighters to proactive planners who are ready for whatever comes their way. Seeing a full rundown of software capabilities can help illustrate how these pieces fit together. You can explore a detailed list of TimberCloud's platform features here to see how each component provides another layer of control, helping you build a more predictable and profitable business.
How AI and Machine Learning Create a Competitive Edge
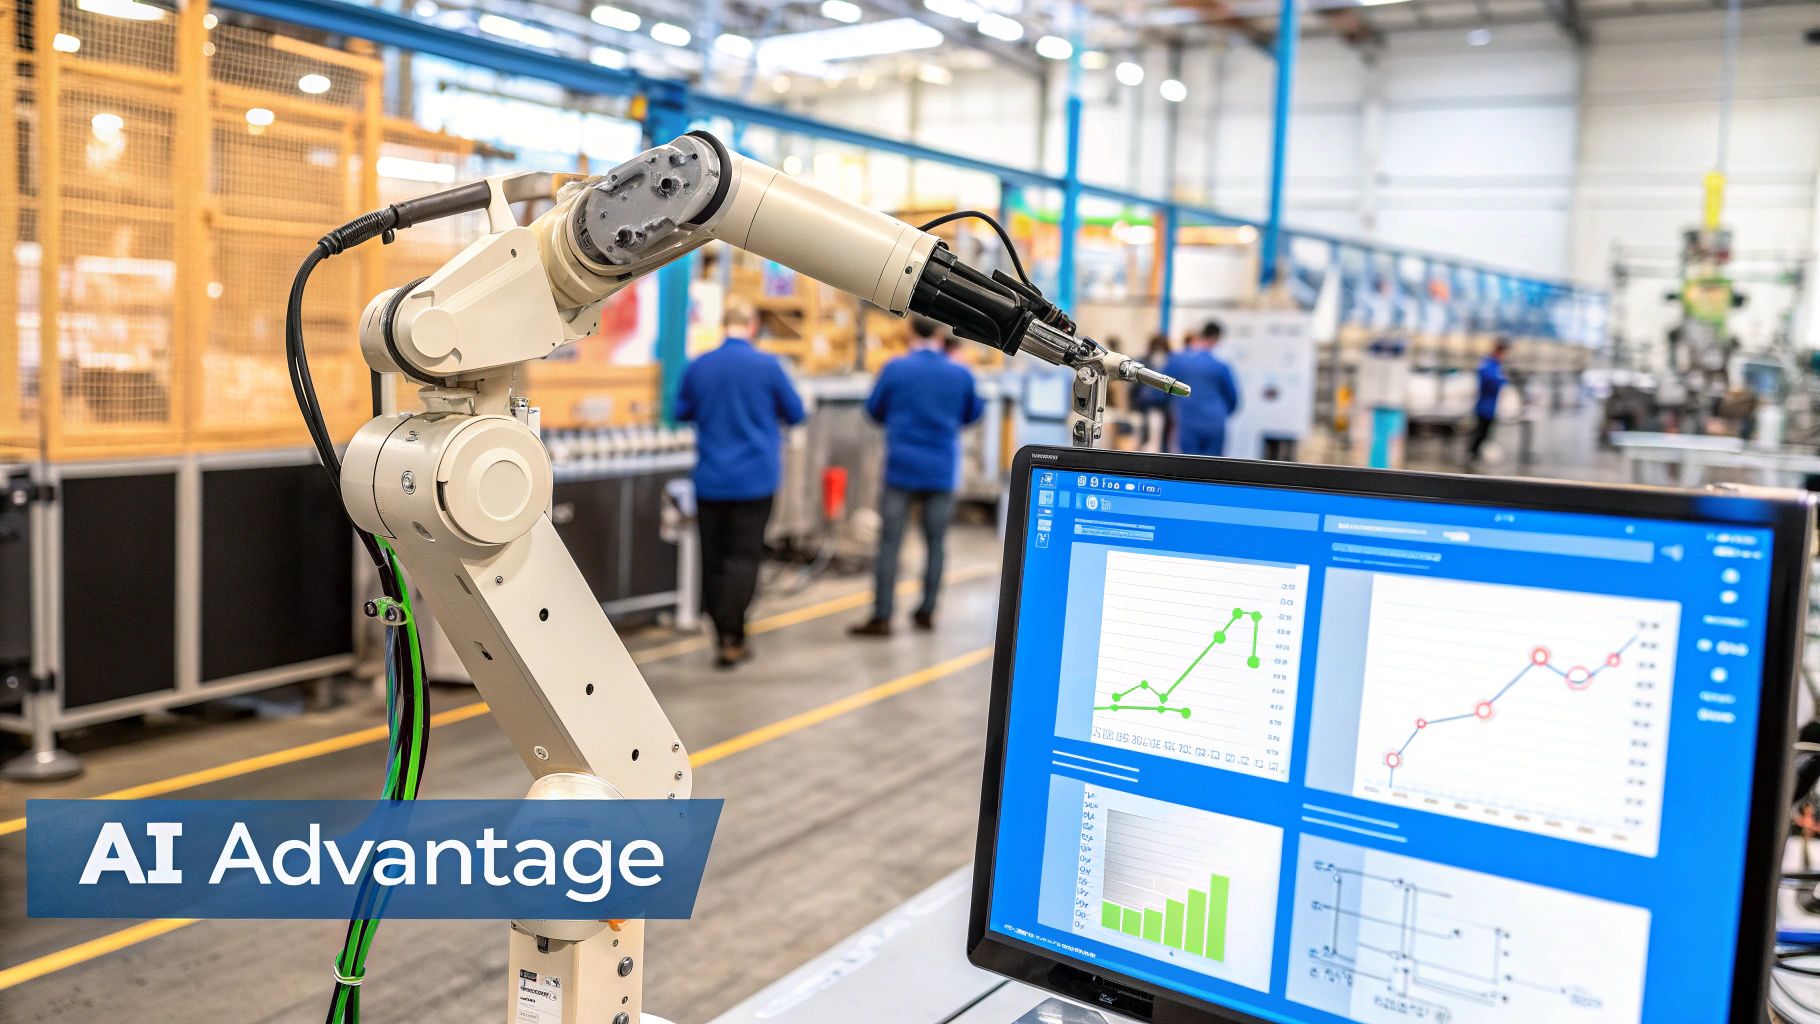
If traditional forecasting is like using a map based on where you’ve already been, then adding Artificial Intelligence (AI) and Machine Learning (ML) is like having a live GPS that sees traffic jams miles ahead. This is the point where manufacturing forecasting software stops being a simple planning tool and becomes a genuine strategic weapon.
AI and ML algorithms dig much deeper than historical averages. They're built to find the hidden correlations and subtle patterns in your data that even a seasoned analyst with a complex spreadsheet would likely miss. It's the difference between following a recipe and having a master chef's intuition.
These smart systems chew through massive datasets—everything from past sales and production cycles to outside influences like economic trends or even weather patterns. The result is a forecasting model that's not just static, but alive and constantly improving.
From Reactive to Predictive Planning
Let's be honest, traditional methods often trap you in a cycle of reacting to yesterday's problems. AI flips that script entirely. It helps you spot trouble before it ever hits your shop floor, which is a lot like fixing a leaky pipe instead of just mopping up the water.
This shift toward forward-looking planning is powered by a few key capabilities:
- Pattern Recognition: AI can pick up on faint demand signals or new seasonal trends way before they'd show up in a standard report.
- Anomaly Detection: The system can flag a machine that’s running just a little bit slower than normal, alerting you to a maintenance need before a full-blown breakdown happens.
- Continuous Learning: Every single sales order, production run, and supplier delay becomes a new lesson. The ML model takes in this fresh data and constantly refines its own logic to make smarter predictions. Your forecast doesn't just stay accurate; it actually gets better over time.
By automating the heavy lifting and learning from new data in real-time, AI-powered forecasting doesn't just spit out predictions. It delivers smart, optimized recommendations that help you build a far more agile and resilient operation.
Unlocking Deeper Operational Insights
The huge benefits of predictive analytics are really what gives AI and machine learning their power here, letting the software act as a 'crystal ball' for your business. And this intelligence isn't just about predicting sales; it's about boosting efficiency everywhere.
Take additive manufacturing, for example, where software revenues are expected to nearly triple from US$2.44 billion to US$6.78 billion by 2033. That growth is being driven by AI tools that predict material usage and spot potential production flaws, which is critical for quality and yield in such complex processes.
That same predictive power applies directly to custom woodworking and millwork. By understanding the complex links between materials, machine setups, and job difficulty, an AI-driven system gives you far more accurate lead times and capacity plans. It helps you answer tough questions with real confidence. To see how these ideas work in the real world, check out more articles on our blog: https://timbercloud.com/blog
At the end of the day, manufacturers who embrace this technology get a massive leg up. They can promise delivery dates they know they can meet, slash waste by ordering materials with pinpoint accuracy, and pivot faster than competitors who are still looking in the rearview mirror.
A Practical Roadmap to Software Implementation
Taking the leap into new manufacturing forecasting software can feel overwhelming. Let's be honest, it's a big move. But breaking it down into a clear, practical roadmap turns a daunting project into a series of achievable wins. Think of this less as a tech rollout and more as a fundamental upgrade to how you run your business.
The real work starts before you even think about installing anything. The first, most critical step is getting brutally honest about your data. Your forecast is only as good as the numbers you feed it. That means digging into your ERP, shop floor systems, and sales channels to make sure the data is clean, consistent, and—most importantly—accurate.
Phase 1: Laying the Foundation
Before you flip the switch on anything, you need to prepare the ground. This phase is all about setting the stage for a smooth transition and giving the software what it needs to deliver value right out of the gate. It's like prepping the soil before planting; the effort you put in now determines how successful the harvest will be later.
Here's what to focus on first:
- Data Health Check: Time for an audit. Are your Bills of Materials (BOMs) actually correct? Is your inventory data reflecting what's really on the shelves? Hunt down and fix those inconsistencies now, or you'll fall victim to the classic "garbage in, garbage out" trap.
- Define What Success Looks Like: How will you know if this is working? Decide on your Key Performance Indicators (KPIs) and get a baseline. Measure your current forecast accuracy, on-time delivery rates, and inventory carrying costs so you can see the improvement later.
- Assemble Your A-Team: You can't do this alone. Designate a project champion and pull together a small, cross-functional team with folks from sales, production, and purchasing. Getting them involved early is the secret to getting company-wide buy-in.
A common mistake is trying to do everything at once with a "big bang" rollout. Don't. A much smarter move is to start with a focused pilot project. Pick one product line or a single production cell to prove the concept. You'll build confidence and work out the kinks on a much smaller, manageable scale.
Phase 2: The Pilot Project and Integration
With a solid foundation in place, it’s time to get your hands dirty with the pilot. This is where the software finally connects to your real-world operations, giving you the first glimpse of what it can truly do. Your goal here is simple: score a quick win that proves the value of data-driven forecasting to everyone else.
During this phase, you'll be connecting the new software to your existing systems, especially your ERP. This integration isn't optional—it's what allows for the seamless flow of data that makes all this work. Once it's hooked up, run the new system in parallel with your old spreadsheet-and-gut-feel method for a bit. Compare the results and prove to yourself that the new way is better.
This is also the perfect time for some initial team training. But don't just show them how to click the buttons; explain why this new tool matters. When your team understands it’s there to eliminate tedious manual work and prevent those frustrating stockouts, you'll see adoption rates go through the roof.
Phase 3: Scaling and Continuous Improvement
Once your pilot is a proven success and you have hard numbers to back it up, you can start rolling it out to other parts of the business. Take the lessons you learned from the pilot and use them to make each subsequent rollout even smoother.
As you expand, keep a close eye on those KPIs you set back in phase one. This isn't a "set it and forget it" solution; it's about creating a cycle of continuous improvement. Manufacturers who truly commit to integrated systems see incredible results. In fact, many report double-digit drops in last-minute expedited orders and a 10–30% reduction in inventory levels within the first 12–24 months. These aren't just numbers; they represent a powerful shift from constantly fighting fires to proactively planning for the future. You can learn more about these operational improvements from Grand View Research.
Here are a few of the most important metrics to keep an eye on as you move forward.
Key KPIs to Track After Implementation
| KPI | What It Measures | Why It's Important |
|---|---|---|
| Forecast Accuracy | The difference between your forecasted demand and actual sales. | This is the ultimate test. Higher accuracy means less wasted inventory, fewer stockouts, and more efficient production schedules. |
| Inventory Turnover | How many times you sell and replace your inventory over a specific period. | A higher turnover rate indicates you're not tying up cash in slow-moving stock. It's a key sign of a healthy, lean operation. |
| On-Time Delivery Rate | The percentage of orders delivered to customers by the promised date. | This directly impacts customer satisfaction and retention. Better forecasting leads to more reliable production and delivery promises you can keep. |
| Stockout Percentage | How often a specific item is out of stock when a customer places an order. | Reducing stockouts prevents lost sales and keeps your customers happy. It shows your material and production planning is in sync with demand. |
| Expedited Freight Costs | The amount you spend on rush shipping to meet deadlines or fix inventory shortages. | This is a direct measure of inefficiency. A sharp drop in these costs is a clear sign your forecasting is preventing last-minute emergencies. |
Ultimately, the goal is to find a system that not only solves today's problems but can also grow with you. As your business evolves, your tools need to keep up. Exploring what's out there can help you land on a solution that fits both your current needs and your future ambitions. To see how a scalable platform can support your journey, you can review TimberCloud’s pricing and feature tiers.
Common Mistakes to Avoid on Your Forecasting Journey
Knowing what to do is important, but knowing what not to do can save you from a world of hurt. Adopting new manufacturing forecasting software is a huge step forward, but a few common mistakes can easily sabotage your efforts before you even get off the ground.
Dodging these pitfalls is the key to making your switch to data-driven planning a success, not a story your team tells for years about "that time we tried the new software."
The "Garbage In, Garbage Out" Trap
By far, the biggest and most damaging mistake we see is ignoring the quality of your own data. It’s simple, really. Your new, powerful software is like a high-performance engine. If you feed it dirty fuel, it’s going to sputter and fail. You can't expect brilliant insights from bad information.
If your Bills of Materials (BOMs) haven't been updated since last year or your inventory counts are more of a "best guess," your new software will just help you make the same old mistakes, only faster. The forecasts it spits out will be built on a foundation of sand, and your team will lose faith in the system almost immediately. Once that trust is gone, your investment is pretty much worthless.
How to fix it: Before you even think about flipping the switch on a new system, commit to a full data audit. It’s not the glamorous part, but it's essential. Clean up your records, get those BOMs validated, and make sure your inventory and sales data are buttoned up and accurate. This upfront grind is non-negotiable, but it pays for itself the moment your new software starts producing forecasts you can actually rely on.
A forecast is only as trustworthy as the data it’s built on. Investing time in data preparation is the single most important step you can take to guarantee the success of your new forecasting system.
Picking a Tool That Doesn't Get Your Business
Another classic misstep is choosing a generic forecasting tool that wasn't built for the messy reality of custom manufacturing. A system designed for a retailer selling thousands of the same t-shirt simply can't grasp the complexities you deal with every day. It doesn't understand configurable products, wild swings in lead times for specialty materials, or the domino effect of dependencies in a custom shop.
When you have a mismatch like that, you just end up with a team that's constantly frustrated. They'll be forced to invent clumsy manual workarounds, which completely defeats the point of having the software in the first place. You’re left with an expensive, ill-fitting tool that adds steps to your workflow instead of removing them.
How to fix it: Zero in on manufacturing forecasting software that was purpose-built for businesses like yours. Hunt for features that speak directly to your pain points—things like deep BOM integration, true capacity planning for one-off jobs, and the ability to model your unique, multi-level production reality.
Make sure the tool understands your world. When you get the right fit, you give your team a tool that feels like it was made for them, one that solves their biggest headaches without a fight. That’s where you’ll find real efficiency and a return on your investment.
Frequently Asked Questions
When you start digging into manufacturing forecasting software, a few questions always seem to pop up. Getting straight answers is the first step toward feeling confident you're making the right move for your shop. Let's walk through some of the most common ones.
How Long Does It Take to See Results?
You'll see some wins right away, like having all your data in one place and finally getting a clear picture of what's happening. But the real, bottom-line impact? That usually starts to show up within 6 to 12 months.
This is the timeframe where most shops see a serious drop in excess inventory—often by 10-30%—and start dodging those frustrating, expensive stockouts. The speed really depends on the state of your data and how quickly your team gets on board with the new process. Think of it as a gradual tuning of your operations, not flipping a magic switch.
Is Forecasting Software Only for Large Enterprises?
That used to be the case, but not anymore. This is a myth left over from a time when these tools were clunky, incredibly expensive, and required a whole IT department to manage. Today, things are completely different.
Modern, cloud-based platforms are built for small and mid-sized manufacturers. They're typically sold as a service (SaaS), which means you can start small with just the tools you need right now. As you grow, you can add more features. It's a way for smaller shops to get the same competitive edge as the big guys without breaking the bank.
Do I Need a Data Scientist to Use AI-Powered Tools?
Not a chance. The best modern forecasting tools are built for the people on the factory floor—your planners, schedulers, and ops managers. You definitely don't need a degree in data science to get value out of them.
The heavy lifting—all the complex math and algorithms—happens behind the scenes. The software is designed to give your team clear, simple recommendations you can act on. The goal is to make smart decisions easier, not to turn everyone into a statistician.
What Is the Single Most Critical Factor for Success?
If I had to pick just one thing, it would be data quality. It's that simple. Your forecast is a direct reflection of the data you feed it. If your Bill of Materials is a mess or your inventory counts are off, you'll get garbage predictions.
Spending the time upfront to clean, organize, and validate your data is the most valuable investment you can make in this process. Getting this right from the start ensures the software gives you forecasts your team can actually trust and rely on, day in and day out.
Ready to replace guesswork with data-driven precision? TimberCloud provides an all-in-one platform that connects inventory, production, and AI-powered planning into a single workflow designed for custom manufacturers. Discover how TimberCloud can transform your forecasting at https://timbercloud.com.
Topics
TimberCloud Team
Content Team
The TimberCloud team is dedicated to helping manufacturers streamline their operations with intelligent software solutions.