How to Calculate Throughput for Your Custom Woodworking Shop

Alright, let's get into the nitty-gritty of what makes a custom woodworking shop truly hum. It all boils down to one powerful metric: throughput.
Think of it this way: throughput is the pulse of your business. It tells you exactly how fast you're turning raw lumber and sheet goods into finished, sellable products. We're not talking about abstract factory numbers here; this is a direct measure of your shop's health and its ability to generate cash.
When you start measuring throughput, you're forced to look at your entire operation as one cohesive system. It's no longer about how fast one guy can run the edgebander or how many parts the CNC can nest in an hour. It's about the final, finished product ready to head out the door. This shift in perspective is a game-changer because it instantly shines a spotlight on the real constraints holding your business back.
Why Throughput is the Metric That Matters Most
Let's be honest, gut feelings don't pay the bills. Focusing on throughput gives you hard data to answer the questions that keep you up at night:
- Are we actually getting better? Tracking this number over time shows you whether your process improvements are working or just wishful thinking.
- What's the real bottleneck? A stagnant throughput rate is a massive red flag that something, somewhere, is gumming up the works.
- Can we handle that big job? Knowing your shop’s true capacity means you can quote lead times with confidence and stop guessing.
Before we dive deep into the calculations, let's get a quick overview of the key metrics you'll be working with.
Key Throughput Metrics at a Glance
This table is your cheat sheet—a quick reference for the core concepts we're about to unpack. These are the numbers that will help you diagnose your shop's performance.
| Metric | What It Measures | Simple Formula |
|---|---|---|
| Throughput Rate | How many units your shop finishes in a specific time period. | Total Units Out / Total Time |
| Cycle Time | The total time it takes to produce one unit from start to finish. | Total Production Time / Total Units Out |
| Takt Time | The production pace needed to meet customer demand. | Available Production Time / Customer Demand |
We'll break down exactly how to calculate and use each of these to fine-tune your operations, but this gives you a solid foundation to start from.
The basic formula for throughput is surprisingly simple: divide your Total Production Output (the number of finished units) by the Total Production Time. That’s it. For a factory that spits out 10,000 widgets in an 8-hour shift, the throughput is 1,250 widgets per hour. This simple calculation is incredibly powerful because it forces you to account for all downtime, revealing your true operational efficiency. You can find more great insights on improving your throughput rate at Worximity.com.
The Bottom Line: Throughput isn't about isolated pockets of speed; it's about the rate at which you generate revenue. A lightning-fast CNC is useless if the finishing department is buried and can't keep up. The only number that truly matters is what gets loaded onto the truck.
Once you embrace this, you can stop playing whack-a-mole with problems and start systematically strengthening the weakest link in your production chain. This is how you slash lead times, reduce that pile of work-in-progress, and make your shop more profitable—often without spending a dime on new equipment. It all begins with getting a handle on your numbers.
Gathering the Right Data for Accurate Calculations
You’ve heard the old saying, “garbage in, garbage out.” It’s a bit of a cliché, but when it comes to calculating your shop’s throughput, it’s the absolute truth. If you want numbers that actually mean something, you need clean, reliable data. It's time to ditch the old clipboard and stopwatch.
The first big question every custom woodworking shop faces is: what exactly are we measuring? When every job is a one-off, defining a standard "unit" of production can feel impossible. Is it a finished cabinet? A linear foot of crown moulding? A completed project?
There isn't a single magic answer that works for everyone. The most important thing is to pick a unit that makes sense for your shop's primary workflow and then stick to it. Consistency is everything.
Defining Your Production Unit
Getting this right is the first step toward any meaningful measurement. This defines the "what" in your throughput formula. Here are a few ways I’ve seen successful custom shops approach it:
- By Project Component: This works great if you have repeatable elements within your custom jobs. You can track the completion of things like drawer boxes, cabinet doors, or assembled carcasses.
- By Project Phase: A higher-level view that measures how many jobs move from one department to the next. For example, how many jobs did the finishing team complete this week?
- By Financial Value: This is a more advanced but powerful method. You measure the dollar value of completed work shipped out the door per day or week, directly tying your production to your revenue.
Once you’ve settled on your unit, the next piece of the puzzle is tracking your Total Production Time. And I don't just mean the hours your machines are running. This is the entire block of time you’ve allocated for production, including all the messy, real-world interruptions.
A huge mistake I see shops make is only counting "productive" hours. Your true production time must include planned breaks, unplanned downtime (like a CNC repair), and job changeovers. If you ignore these, you’ll get a rosy, inflated throughput number that doesn't reflect what your shop can actually deliver.
This is where manual tracking falls apart. Did anyone remember to log that the edgebander was down for 45 minutes on Tuesday? Was the time spent swapping tools on the CNC actually accounted for? These little gaps in your data will completely throw off your results.
This visualization breaks down the basic flow—turning raw materials and labor (input) into finished, shipped products (output).
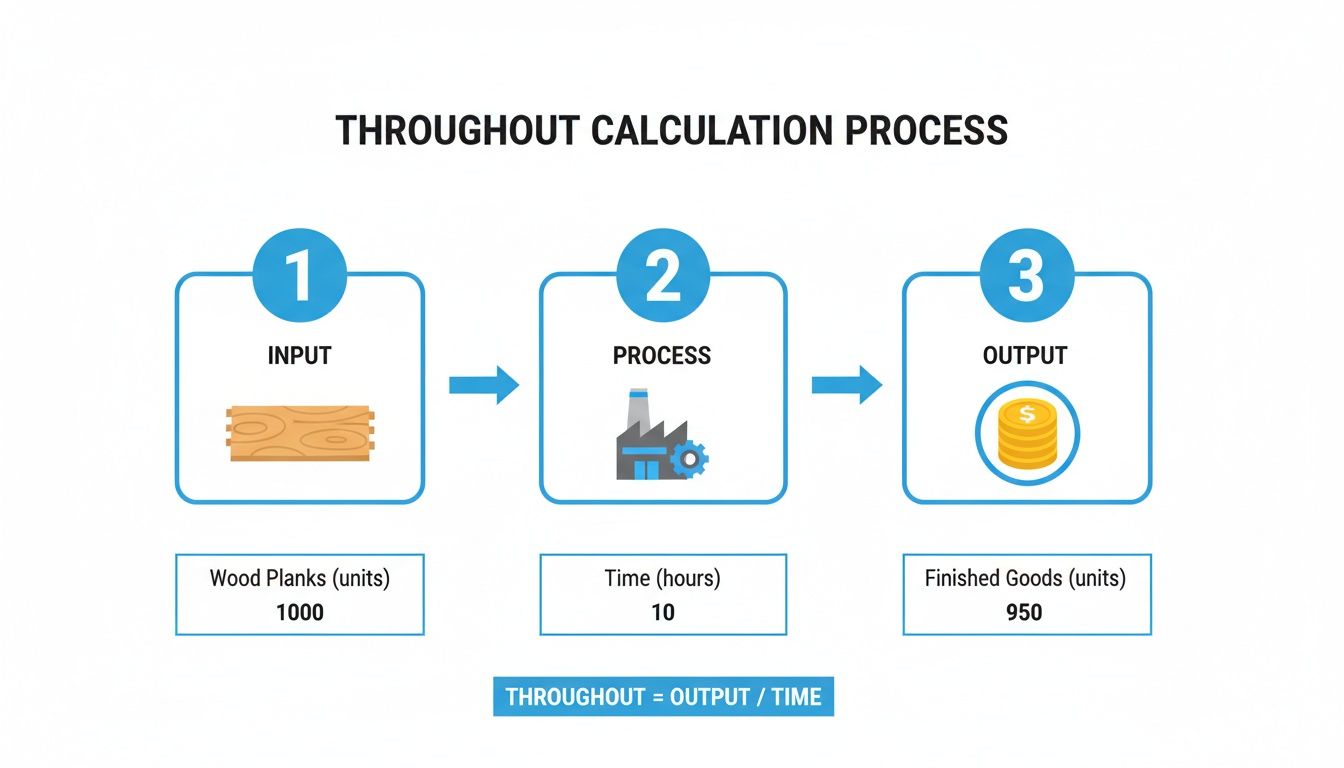
As the infographic shows, that "process" stage is where all your time, money, and resources are spent. Nailing the data collection here is non-negotiable if you want a calculation you can trust.
Automating Data Collection for Precision
To get insights you can actually use to make decisions, you need a system that captures what’s happening on the shop floor automatically, in real-time. This is exactly what modern production tracking software was built for. Instead of relying on someone’s memory or scribbled notes, these systems track a job’s progress as it moves through each station.
This automated approach gets rid of manual errors and gives you a crystal-clear picture of your operations. You can see exactly how long each phase is taking, spot where jobs are getting bogged down, and know your actual output without any of the guesswork.
For more on boosting operational efficiency, you can find other helpful guides on our blog. And while optimizing what happens inside your shop is key, don’t forget about external costs—for example, knowing how to calculate shipping charges accurately is crucial for protecting your margins on finished products.
By building this solid data foundation, you stop speculating about problems and start identifying them with certainty. You're no longer just guessing where your bottlenecks are; you have the hard numbers to prove it. This is the essential groundwork for making smart, data-driven decisions that will genuinely improve your shop’s performance and profitability.
Putting These Formulas to Work on Your Shop Floor
Alright, let's get our hands dirty. It’s one thing to know the theory behind manufacturing metrics, but it’s another thing entirely to use them to make a real difference in your shop. The goal here is to turn these formulas into powerful tools you can start using today to see exactly what’s going on with your production. We’ll skip the generic factory examples and focus on scenarios that custom millwork and cabinet shops face every single day.
Think of these formulas less as academic exercises and more as diagnostic tools. Each one offers a different lens to view your shop’s performance, helping you pinpoint those hidden inefficiencies and, more importantly, uncover opportunities you didn't even know you had.
Mastering the Basic Throughput Rate
The first and most direct measure of your shop’s pulse is the Throughput Rate. This is the bottom line: how many finished goods are you actually producing in a given amount of time? It’s the simplest, most fundamental metric for your operation.
The formula couldn’t be easier: Throughput Rate = Total Units Produced / Total Time
Let's make this real. Say your assembly crew is cranking out standard 24-inch, three-drawer base cabinets. In one 8-hour shift, they manage to complete 16 of them, ready for the finishing department.
- Total Units Produced: 16 cabinets
- Total Time: 8 hours
Plug those numbers in, and you get 16 cabinets / 8 hours = 2 cabinets per hour.
That simple figure, 2 cabinets per hour, is your throughput rate. It’s a hard number you can track day in and day out. Is it trending up or down? Are certain shifts or teams outperforming others? This is your starting line for really managing performance.
Your throughput rate is the ultimate truth-teller. It cuts through opinions and excuses to reveal precisely what your shop is capable of producing right now. If that number isn't high enough to be profitable, you know you have a problem to solve.
Another useful angle, especially if you have a lot of work-in-progress, comes from Little's Law: Throughput = Inventory / Flow Time. Imagine a furniture maker with 100 chairs in various stages of production (inventory) and it takes an average of 10 days for a chair to go from raw lumber to sold (flow time). Their throughput is 10 chairs per day. This became a critical way of thinking during the 2008 financial crisis when shops realized just how much cash was tied up in inventory. If you want to dig deeper, Factbird's guide on production performance is a great resource.
Uncovering Bottlenecks with Cycle Time
While throughput gives you the big-picture output, Cycle Time zooms in on the efficiency of your process for a single unit. It measures the total time from the moment work starts on a part or assembly until it's completely finished.
If you’re hunting for bottlenecks, Cycle Time is your best friend.
The formula is basically the inverse of your throughput rate: Cycle Time = Total Production Time / Total Units Produced
Let’s go back to our cabinet shop example:
- Total Production Time: 8 hours (which is 480 minutes)
- Total Units Produced: 16 cabinets
The math is straightforward: 480 minutes / 16 cabinets = 30 minutes per cabinet.
This tells you that, on average, a finished cabinet is rolling off your assembly line every 30 minutes. But the real power comes when you measure the cycle time for each station. What if the CNC takes 15 minutes per cabinet, assembly takes 30 minutes, and the finishing booth takes a full 60 minutes? You’ve just found your bottleneck. It’s the finishing department. You simply can't achieve a shop-wide cycle time faster than your slowest process.
Aligning Production with Takt Time
Finally, we have Takt Time, a brilliant concept that directly connects your production pace to what your customers actually need. "Takt" is a German word for "beat" or "rhythm," and that’s precisely what this metric helps you find—a production rhythm dictated by your customer deadlines.
Takt Time answers one critical question: "How fast do we need to be working to meet our commitments?"
Here’s the formula: Takt Time = Available Production Time / Customer Demand
Let's say you landed a contract to deliver 80 custom vanities for a multi-family project, and you have 20 working days to get it done. Your shop runs one 8-hour shift.
First, figure out your actual, available production time:
- Available Time per Day: 8 hours - 1 hour (for breaks, cleanup, meetings) = 7 hours, or 420 minutes
- Total Available Time: 420 minutes/day × 20 days = 8,400 minutes
Next, what’s the demand?
- Customer Demand: 80 vanities
Now, let's calculate the Takt Time: 8,400 minutes / 80 vanities = 105 minutes per vanity.
That number is your target. To hit the deadline without chaos and overtime, your shop needs to produce one finished vanity every 105 minutes. Now you can compare this to your measured Cycle Time. If your actual Cycle Time is 120 minutes, you're falling behind and need to find a way to speed things up. But if your Cycle Time is 90 minutes, you're ahead of schedule, which gives you a welcome buffer for the inevitable hiccups.
How to Analyze Your Results and Pinpoint Bottlenecks
So, you’ve put in the legwork, gathered the data, and calculated your initial throughput metrics. Great. But raw numbers on a spreadsheet don’t fix problems. The real magic happens now, when you turn that data into a story about what’s actually happening on your shop floor. This is where you build a roadmap to a more efficient and profitable operation.
The whole point of this exercise is to find the one single thing holding you back—your bottleneck. Every single shop has one. It’s that one process, machine, or department that sets the speed limit for your entire operation. Here’s the hard truth: improving anything other than the bottleneck is a waste of time and won't actually increase your overall output.
Think of your shop like a chain. You’re only as strong as your weakest link. Finding and strengthening that link is the only way to make the whole chain stronger.
Finding Your True Constraint
The most straightforward way to unearth your primary bottleneck is to compare the cycle time for each stage of your workflow. Just map out your process from start to finish—panel saw to CNC, edgebander, assembly, and finally, the finishing booth. Then, look at your data. How long does a typical part or job spend at each station?
The station with the longest cycle time is your bottleneck. It’s usually that simple.
Let's walk through a quick example. Imagine a custom cabinet job flows through your shop with these average cycle times:
- Cutting & CNC: 25 minutes
- Edgebanding: 15 minutes
- Assembly: 40 minutes
- Finishing & Curing: 75 minutes
In this shop, it’s painfully obvious where the problem lies. Work is piling up right in front of the finishing department. It doesn’t matter how fast the CNC can cut parts or how efficiently the team can assemble boxes. The shop physically cannot produce a finished cabinet faster than one every 75 minutes. The finishing booth is the undeniable constraint.
It’s crucial to understand that time saved at a non-bottleneck station is a total illusion. If you push your CNC operator to shave five minutes off his time, but the finishing booth is already swamped, you haven't gained anything. You’ve just created a bigger pile of work-in-progress, which ties up cash and clutters the shop.
Common Bottlenecks in Custom Woodworking
While every shop’s DNA is a little different, experience tells us that the same culprits tend to cause slowdowns over and over again. Your bottleneck is almost certainly lurking in one of these areas.
The Finishing Department
This is, without a doubt, the most common bottleneck in our industry. Finishing is a complex dance of sanding, spraying, drying, and curing—all of which eat up time. A single spray booth can easily become the choke point that dictates the pace for everyone else.
If finishing is your constraint, you've got a few options:
- Optimize Your Process: Can you switch to a faster-curing lacquer? Could a new type of spray gun speed up application or cut down on rework?
- Stagger Schedules: Instead of dumping an entire kitchen’s worth of doors and drawers on them at once, try feeding smaller, more consistent batches throughout the day. This creates a much smoother flow.
- Invest in Technology: It's a big step, but automated spray lines or dedicated curing rooms can absolutely shatter a finishing bottleneck, unlocking huge production capacity.
Assembly and Sub-Assembly
This is where all those perfectly cut parts are supposed to come together seamlessly. When a bottleneck pops up here, it’s often a symptom of disorganization. Are your guys constantly walking around looking for the right screws or drawer slides? Is the workbench so cluttered they have to move a cabinet three times just to assemble it?
Look for simple, practical fixes first. Setting up dedicated assembly cells where all the necessary tools and hardware are within arm's reach can be a game-changer. Something as simple as pre-sorting and bagging hardware for each job before it gets to the bench can have a massive impact.
The Design and Engineering Phase
Sometimes, the biggest logjam isn't even on the shop floor. If your production crew is constantly standing around waiting for approved drawings, cut lists, or CNC programs, then your bottleneck is in the office.
This "soft" bottleneck is easy to overlook, but it's just as damaging as a slow machine. The handoff from design to production has to be seamless. Using modern design software that pushes production-ready info straight from the 3D model to the machines is key. It eliminates those costly delays and human errors, ensuring the shop floor always has what it needs to keep the line moving. Analyzing these upstream processes is a vital part of understanding how to calculate throughput for your business as a whole, not just the factory.
Using Technology for Continuous Throughput Improvement
Calculating your throughput once is a decent starting point, but the real magic happens when you track it continuously. This is where modern shop technology gives you a serious competitive advantage, shifting you from static, outdated snapshots to a live, dynamic view of your shop’s health.
Think of it this way: would you rather have a single photograph of your operations from last week, or a live video feed of what’s happening right now?
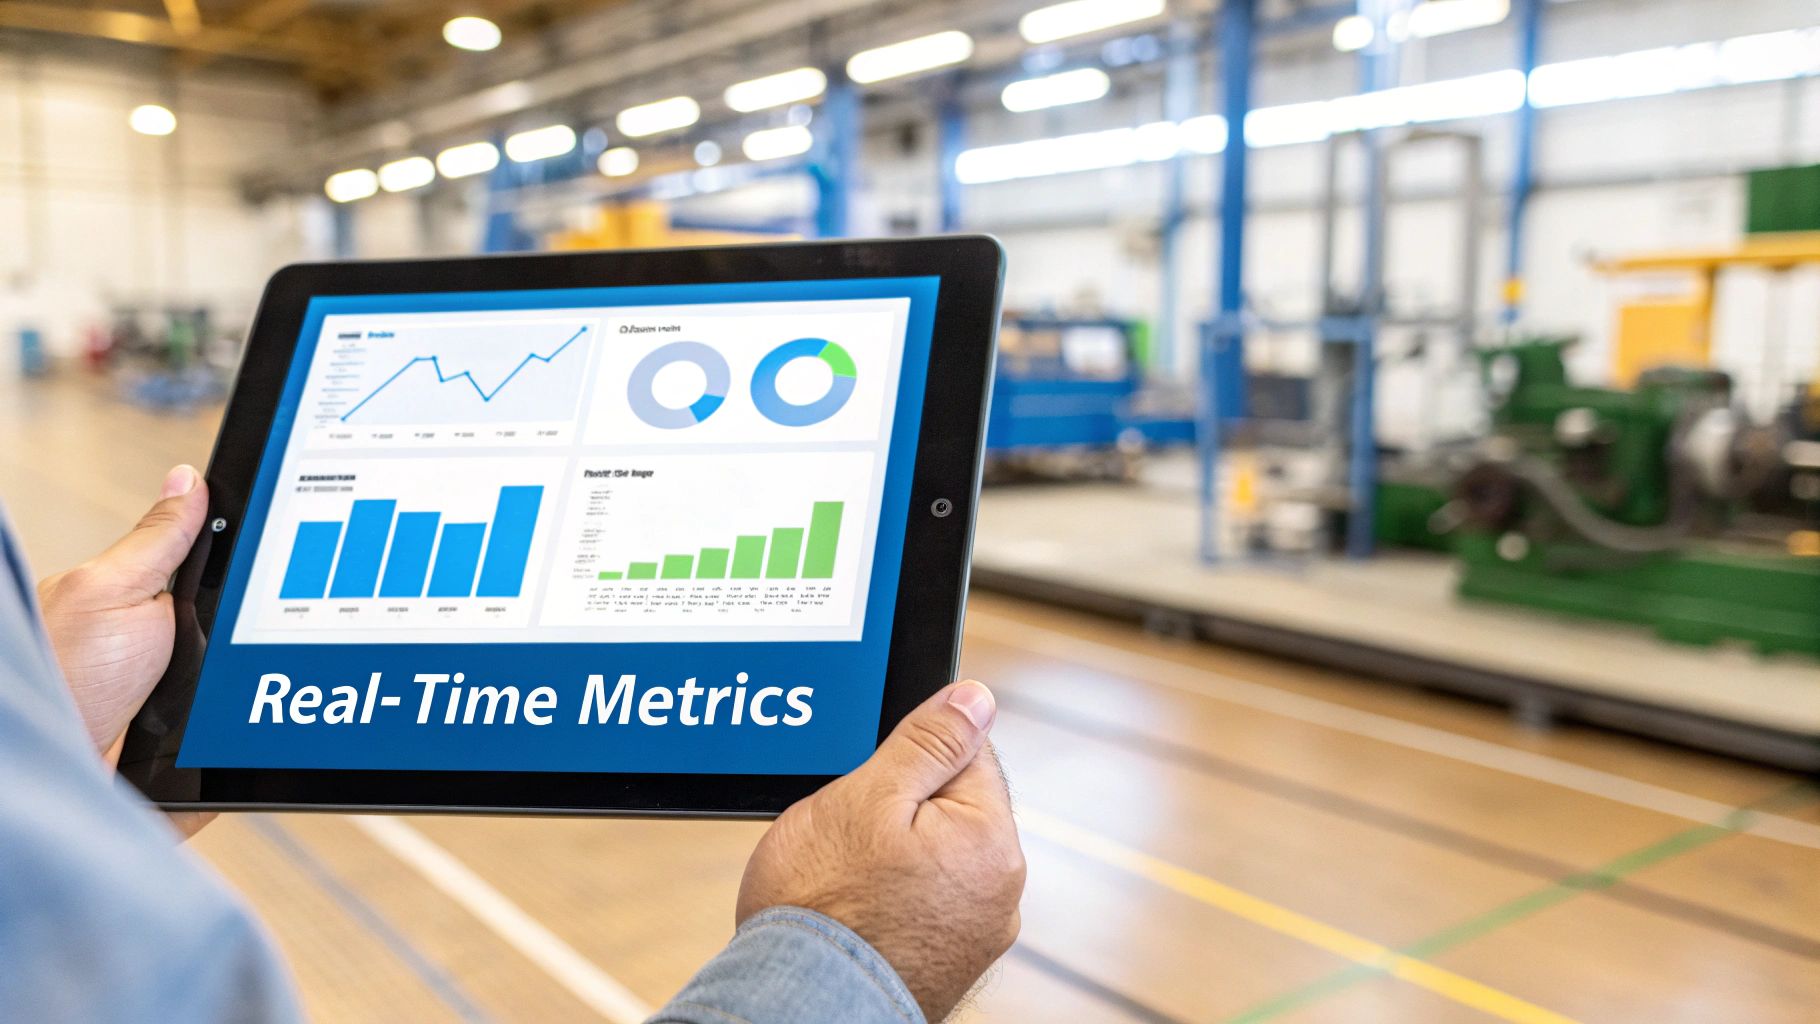
That's the difference-maker. Platforms like TimberCloud are built to deliver this exact kind of real-time visibility. Forget manually punching numbers into spreadsheets at the end of the day. These systems capture progress as it happens, automatically crunching the numbers on key metrics like throughput rate, cycle time, and overall efficiency. For a custom woodworking shop, this continuous data stream is a total game-changer.
From Guesswork to Data-Driven Decisions
When you have live data at your fingertips, you can finally stop managing based on gut feelings and start making truly informed decisions. This is where the ROI from technology really shines.
With a real-time dashboard, you can see the second a station starts to fall behind or a job takes longer than planned. It lets you step in and solve small issues before they snowball into massive delays that throw your entire production schedule into chaos.
The goal is to move from reactive firefighting to proactive optimization. When your team can see a live scoreboard of their performance, it naturally builds a culture of accountability and a desire to improve.
Imagine setting realistic daily or weekly throughput targets based on actual historical data. You can display those goals on a screen right on the shop floor, giving your crew a clear, measurable target to aim for. Suddenly, production becomes a shared goal, not just a top-down mandate.
Setting Benchmarks and Motivating Your Team
Live production tracking isn’t just for spotting problems—it’s also for celebrating wins. Having clear, unbiased data empowers you to:
- Establish Clear Performance Benchmarks: You'll know exactly what your shop's average throughput is, which means you can set ambitious but achievable goals for improvement.
- Identify Your Top Performers: The data doesn't lie. It will show you which teams or processes are your most efficient, giving you a chance to learn from them and replicate their success elsewhere.
- Motivate with Transparency: When everyone can see the numbers, it creates a powerful sense of shared purpose. Hitting a new daily throughput record becomes a victory for the whole team.
This mindset isn't unique to woodworking. Take a look at software development, where principles like CI/CD pipeline best practices to boost efficiency and reliability have revolutionized how teams deliver code. Both disciplines are obsessed with visibility, automation, and a relentless focus on eliminating constraints.
The Bigger Picture of Operational Efficiency
At the end of the day, technology helps you ask smarter questions. Instead of just wondering why a job is late, you can pinpoint the exact stage where the delay happened and why. When you're thinking about buying a new machine, you can use hard data to justify the investment by showing precisely how it will tackle your main bottleneck and boost overall throughput.
This isn’t just a shop-floor concept; it's a universal principle of efficiency. In the world of tech infrastructure, for instance, network throughput is a critical health metric. With cloud traffic growing by 30% every year, companies rely on these precise calculations to prevent costly system-wide slowdowns.
For your shop, it’s about having tools that give you the complete picture. If you want to see how an all-in-one platform can deliver these kinds of insights, you can explore the features of a modern production management system. By embracing technology, you change how you calculate throughput from a tedious accounting task into a powerful, continuous management tool that fuels real profitability and growth.
Common Questions About Calculating Throughput
Switching your shop to a more data-driven mindset is bound to bring up some real-world questions. Once you start digging into how to calculate throughput, you'll hit situations that are unique to the custom world. Let's walk through some of the most common hurdles I see shop owners face.
How Do I Measure Throughput for One-Off Custom Projects?
This is the big one, isn't it? For any custom shop, when no two jobs are the same, trying to track "units per hour" can feel like a waste of time.
The secret is to stop thinking about product throughput and start focusing on process throughput.
Instead of counting finished cabinets, you need to measure the completion of key stages that are consistent across all your projects. This gives you a standard way to measure your shop's speed, even when the final products are wildly different.
Think about tracking things like:
- Designs approved per week: This tells you the real output of your design and engineering team.
- Jobs moved to the finishing department per month: This is a fantastic measure of your fabrication and assembly teams' actual output.
- Projects shipped per quarter: This is your ultimate, high-level throughput number—the one that connects directly to your revenue.
When you break a big, unique project into these standardized phases, you can calculate the throughput for each stage. It's the fastest way to see which part of your workflow is the real bottleneck.
What Is the Difference Between Throughput and Capacity?
It's really easy to mix these two up, but understanding the difference is crucial if you want to make realistic plans for your shop.
Capacity is your shop's maximum theoretical output. It’s what you could build if every machine ran perfectly, 24/7, with zero downtime, changeovers, or material delays. It's a nice number to know for long-term planning, but it's not the reality on the shop floor.
Throughput, on the other hand, is your actual, measured output. It’s the number that tells the true story, factoring in all the real-world hiccups—machine maintenance, employee breaks, rework, and late material deliveries. Throughput is what you are getting done.
The gap between your capacity and your throughput is where your biggest opportunity for improvement lies. Closing that gap is how you get more profitable without buying a single new machine.
How Often Should I Review My Shop's Throughput?
For this data to actually make a difference, throughput can't be a report you glance at once a month. It needs to be a live, or near-live, number that helps you make decisions today. Modern production tracking software makes this kind of real-time visibility possible.
But if you're just starting out and doing this manually, a weekly review is the perfect place to start. It’s often enough to spot problems as they pop up and see if your changes are working, but not so frequent that it becomes a burden to collect the data. Save the monthly or quarterly reviews for big-picture strategic thinking, and use the weekly numbers to make smart moves on the floor.
If you want more personalized advice on setting up a tracking system that works for you, feel free to contact our team for a consultation. We've helped dozens of shops figure out a measurement strategy that fits their specific needs.
Ready to stop guessing and start measuring? TimberCloud provides the real-time production tracking and analytics you need to master your shop's throughput, identify bottlenecks, and drive profitability. Transform your data into your most powerful asset by visiting https://timbercloud.com to see how it works.
Topics
TimberCloud Team
Content Team
The TimberCloud team is dedicated to helping manufacturers streamline their operations with intelligent software solutions.