Mastering Demand Forecast Accuracy in Manufacturing
At its core, demand forecast accuracy is simply a measure of how close your predictions of customer demand come to what people actually buy. But getting this number right is anything but simple. It's the key to dodging costly inventory pile-ups and frustrating stockouts, both of which can wreak havoc on your cash flow and profits.
Why Demand Forecast Accuracy Is Your Secret Weapon
Think of your demand forecast as the GPS for your entire manufacturing operation. When it's accurate, you glide through the market, making confident calls on purchasing, production schedules, and even staffing. When it's off, you're driving blindfolded into one financial traffic jam after another.
This isn't just about hitting a target metric. It's about turning that number into a real competitive advantage. Every single percentage point of improvement sends positive ripples across your business, strengthening your financial footing and making your operations more resilient.
The Real-World Impact of High Accuracy
Improving your forecast accuracy is far more than a technical exercise. It creates tangible results that everyone from the shop floor to the C-suite can see and feel. The benefits are clear, direct, and measurable.
Here's what happens when you get it right:
- Optimized Inventory Levels: You order and produce only what you need. This immediately slashes the carrying costs tied to excess stock and frees up precious warehouse space.
- Reduced Operational Costs: Good forecasting means fewer frantic, last-minute production changes, less overtime pay, and much more efficient use of your machinery and raw materials.
- Enhanced Customer Satisfaction: When you have the right products ready at the right time, you avoid stockouts, ship orders faster, and build the kind of customer loyalty that lasts.
"A precise forecast acts as the central nervous system of a manufacturing business. It informs every major decision, from procurement to production, ensuring all departments are working in sync rather than reacting to constant emergencies."
The Financial Case for Better Forecasting
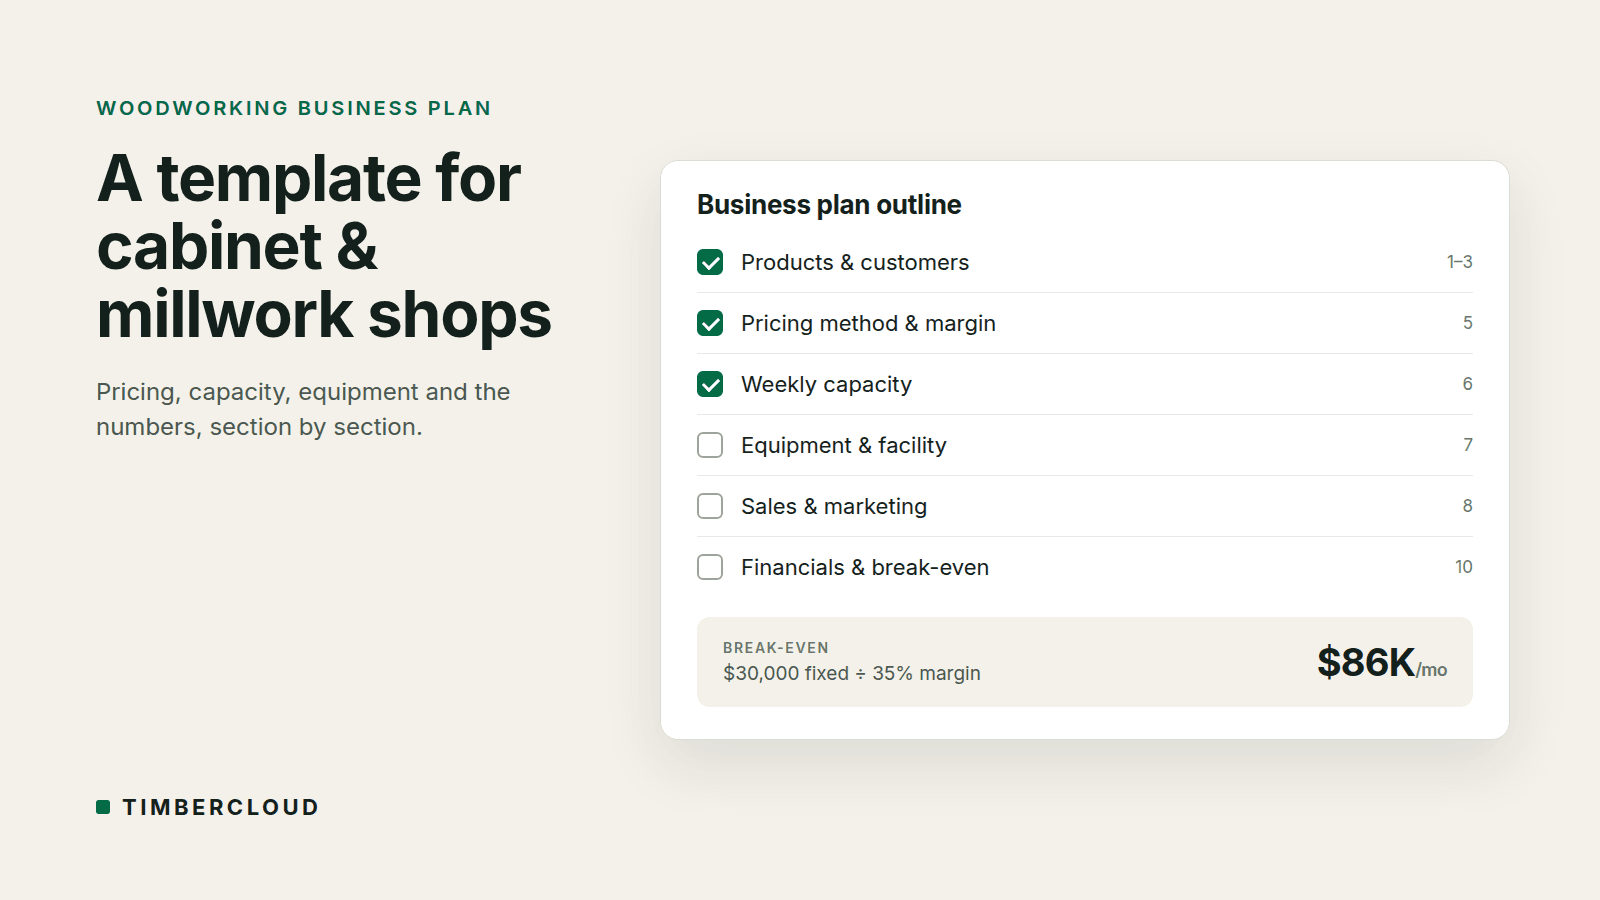
When it comes down to it, the most compelling reason to chase forecast accuracy is its direct link to your bottom line. Bad forecasts are a massive financial drag. For instance, if you forecast a need for 1,000 units but only sell 300, that excess stock ties up working capital that could have been invested in growth. It’s a painfully common and costly mistake.
Even small improvements in your forecast precision can lead to huge gains in inventory turnover and cash flow, making your entire business more agile and profitable. This is because demand forecast accuracy is critical for businesses, directly influencing everything from inventory efficiency to supply chain agility. Understanding this connection is the first step toward building a more robust operation. You can learn more about how forecasting metrics impact your business on easyreplenish.com.
For custom manufacturers especially, mastering this isn't just a "nice-to-have"—it's a survival skill in a volatile market. Getting this right is the foundation for a lean, responsive, and ultimately more profitable business.
The Metrics That Truly Measure Your Accuracy
If you want to get serious about improving your demand forecast accuracy, you have to move past gut feelings and start measuring what actually matters. Think of these metrics as diagnostic tools for your entire operation. They don't just give you a pass-or-fail grade; they tell you why you missed the mark and point you toward the fix. This is how you turn a bunch of confusing acronyms into real business intelligence.
The right numbers show you the true health of your demand planning. They illuminate the path from costly waste and guesswork to sustainable, predictable profit.
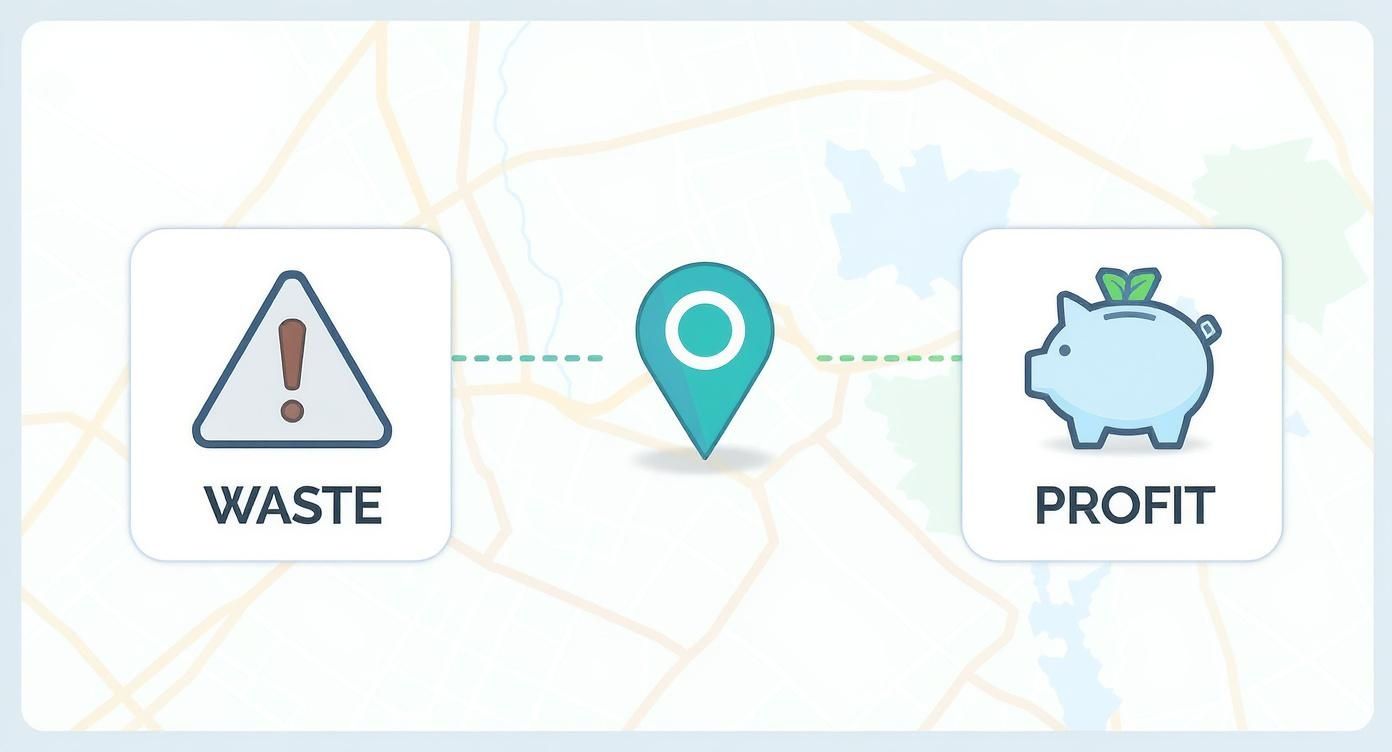
This visual really captures the idea. Accurate forecasting is like a GPS for your business, guiding you straight to profitability while helping you swerve around the potholes of waste and inefficiency. Let's dig into the key metrics that provide this crucial guidance.
Understanding Forecast Bias
One of the most revealing metrics out there is Forecast Bias, sometimes called Mean Forecast Error. Its real power is that it doesn’t just measure how wrong you were—it tells you in which direction you were wrong. Are you constantly overestimating demand and tying up cash in materials you don't need? Or are you underestimating it, leading to frustrating stockouts and unhappy customers?
A positive bias means you're under-forecasting (Actuals > Forecast), leaving money on the table. A negative bias tells you you're over-forecasting (Forecast > Actuals), which leads directly to wasted capital and obsolete inventory.
Forecast Bias is the fastest way to spot a systemic issue. A forecast that's consistently biased in one direction signals a fundamental flaw in your model or a bad assumption in your process. It's a red flag that needs immediate attention before it chews through your margins.
Imagine a custom machine parts manufacturer with a negative bias on a specific metal alloy. That number tells them they're consistently buying and holding too much of an expensive material. Spotting and correcting that bias instantly frees up working capital.
Measuring the Magnitude of Error
While bias tells you the direction of your miss, other metrics help you understand the size of the gap. Two of the most common and genuinely useful KPIs for this are Mean Absolute Percentage Error (MAPE) and Mean Absolute Deviation (MAD).
-
Mean Absolute Percentage Error (MAPE): This one is popular for a reason—it’s intuitive. MAPE expresses your average forecast error as a simple percentage, which makes it incredibly easy to compare accuracy across different products or time periods. A MAPE of 15%, for example, means that on average, your forecast was off by 15%. Plain and simple.
-
Mean Absolute Deviation (MAD): This metric gets more granular, measuring the average size of the error in raw units, ignoring whether you were over or under. If you forecasted 100 units and sold 120, the deviation is 20. MAD is perfect for translating error into tangible terms, which is exactly what you need when planning safety stock levels.
MAPE is fantastic for high-level reporting to management, while MAD is the go-to for day-to-day inventory decisions on the shop floor. For a broader view of how these numbers impact your entire operation, you can explore various supply chain and logistics metrics available on our blog.
Choosing the Right Metric for the Job
Here's the thing: no single metric tells the whole story. The smartest approach is to use a combination of KPIs to build a complete, 360-degree view of your forecasting performance. The "best" metric always depends on the specific business question you're trying to answer.
To make this a bit more concrete, I've put together a table that breaks down the most common metrics we use in custom manufacturing.
Comparing Key Demand Forecast Accuracy Metrics
| Metric (Acronym) | What It Measures | Simple Formula | Best Used For |
|---|---|---|---|
| Forecast Bias | The consistent direction of your forecast errors (too high or too low). | (Sum of Actuals - Sum of Forecasts) / Number of Periods | Identifying systemic flaws in your forecasting process or assumptions. |
| MAPE | The average error as a percentage of actual sales. | (Sum of | (Actual - Forecast) |
| MAD | The average magnitude of the forecast error in absolute units. | Sum of | Actual - Forecast |
| WMAPE | Error weighted by volume, focusing on high-impact products. | Sum of | Actual - Forecast |
By using these tools together, a custom manufacturer can finally stop flying blind. They can see if they are consistently over-forecasting (Bias), understand the average error percentage across their entire product line (MAPE), and know precisely how many units of a critical component they need for safety stock (MAD).
This multi-faceted view is the key to truly mastering demand forecast accuracy.
What a Good Forecast Accuracy Rate Looks Like
Everyone wants the simple, one-sentence answer: what’s a good demand forecast accuracy rate? The honest answer is that a single, universal benchmark just doesn’t exist. A “good” number for a high-volume producer of standard parts is going to look completely different from the target for a custom millwork shop.
The truth is, chasing a perfect 100% forecast is the wrong goal entirely. It’s not just impossible in the real world of shifting markets and unpredictable clients, but the effort to even get close would be ridiculously expensive. The goal isn’t perfection; it’s strategic precision.
This reality is reflected in broad industry data. Believe it or not, the average demand forecasting error over the past five years has hovered around a staggering 48%. What's more, every year over a third of all product volume suffers from extreme errors where sales are more than double or less than half of what was forecasted. You can read the full research about forecast benchmarks to see just how deep these challenges run.
That number isn't meant to be discouraging. It’s actually the opposite—it highlights the massive opportunity sitting right in front of you. Moving the needle by even a few percentage points can give you a significant leg up on the competition.
Setting Realistic Internal Benchmarks
Instead of hunting for an external number to chase, the most successful manufacturers build their own internal benchmarks. They understand that not all products are created equal, so forecasting efforts should be aimed where they deliver the highest financial return.
This strategic approach means slicing up your product catalog and setting different accuracy targets based on a few key factors.
-
Product Lifecycle Stage: New, highly customized products are inherently tougher to predict than established items with years of sales history. It makes sense to set a more lenient accuracy target for new launches and a much stricter one for your bestsellers.
-
Forecast Horizon: It’s far easier to nail the forecast for next week than for next quarter. Your accuracy targets should reflect that, with higher expectations for short-term forecasts and more wiggle room for long-range planning.
-
Strategic Importance: This is the big one. Your high-value, high-margin products deserve the most attention and, consequently, the most aggressive accuracy goals.
A common mistake is treating all forecast errors the same. Missing by 50 units on a low-cost standard screw is a minor headache. Missing by 50 units on a high-cost, long-lead-time custom component can cripple a production schedule and torpedo your profitability.
The A-B-C Approach to Accuracy Goals
A practical way to put this into action is with an A-B-C analysis, a classic method for classifying inventory based on its value to the business.
-
A-Items: These are your superstars—the 20% of items that typically generate 80% of your revenue. For these products, you should set an aggressive forecast accuracy target, maybe 85% or even higher. The financial impact of getting these right is enormous.
-
B-Items: This is your solid middle group. They have a lower financial impact than A-Items but are more significant than C-Items. A reasonable accuracy target here might land in the 70-80% range.
-
C-Items: These are your low-value, high-volume items. While you need them for operations, the cost of a forecasting error is minimal. Here, you can accept a lower accuracy rate, say 50-60%, and lean more on safety stock to handle the variability.
By adopting this segmented approach, you stop wasting energy and resources chasing perfection on trivial items. Instead, you focus your brainpower on improving the demand forecast accuracy for the products that truly move your business forward.
Uncovering the Hidden Killers of Your Forecast
If your forecasts consistently miss the mark, it’s time to stop making excuses and start investigating. Poor demand forecast accuracy isn’t just a string of bad luck; it’s a symptom of deeper issues hiding within your processes, your data, and even your company culture. You have to put on your detective hat and hunt for the culprits that are quietly sabotaging your best-laid plans.
These "hidden killers" usually fall into two main camps. Some are internal, lurking within your own systems and teams. Others are external, thrown at you by the volatile market you operate in. Pinpointing them is the first, and most critical, step toward building a forecast you can actually rely on.
Internal Factors That Sabotage Accuracy
More often than not, the most damaging problems start right inside your own four walls. These are the issues that are entirely within your control to fix, making them the perfect place to start your audit. Left unchecked, they will cripple even the most advanced forecasting software money can buy.
A classic is the "garbage in, garbage out" problem. If your historical sales data is a mess—incomplete, riddled with errors, or miscategorized—your forecasting model is building its predictions on a foundation of sand. It doesn't matter how sophisticated the algorithm is if the data it’s learning from is flat-out wrong.
Another major culprit? Organizational silos. We’ve all seen it happen: the sales team lands a massive, unexpected order but doesn't pass that crucial intel along to operations or procurement. The result is an official forecast that’s completely out of touch with reality, leading to stockouts, production delays, and a brand-new customer who is already frustrated.
This disconnect between departments is a primary driver of forecast inaccuracy. When valuable insights from sales, marketing, and customer service don't flow freely to the planning team, the forecast becomes a theoretical exercise detached from what's actually happening in the market.
External Forces Beyond Your Control
While internal factors are often the easiest to fix, you also have to contend with the curveballs the market throws at you. These are the economic shifts and unexpected events that can make a perfectly good forecast obsolete overnight. You can't control them, but you can build processes to react to them faster.
Common external disruptors include:
- Sudden Market Shifts: A subtle change in local building codes or a new interior design trend can instantly alter demand for specific types of custom woodwork or materials.
- Competitor Actions: A rival launching a surprise promotion or a new product line can pull demand away from your offerings with little to no warning.
- Supply Chain Delays: An unexpected shutdown at a key supplier or a major shipping disruption can create material shortages that directly impact your ability to meet the demand you forecasted.
For custom manufacturers, even a single tweet from the right person can cause chaos. Imagine a high-profile designer showcases a piece of furniture made with a unique wood species you supply. That one social media post could trigger a sudden, massive spike in demand that no historical data could have ever predicted. The key isn't to predict these black swan events, but to have a system agile enough to respond when they happen.
Diagnosing Your Own Process
Achieving high demand forecast accuracy is tough precisely because of these varied and often interconnected factors. Many businesses get bogged down by poor data quality, market volatility, and unforeseen economic shifts. You can discover more insights about demand forecasting challenges from ISM World to see you’re not alone.
To start your own investigation, use this checklist to audit your current process and identify where the weak points are.
- Data Integrity: Is your historical sales data clean, complete, and accurate? Be honest.
- Team Collaboration: Do sales, marketing, and operations actually talk to each other and share insights regularly?
- Model Assumptions: Are the assumptions your forecasting model was built on still valid for today's market conditions?
- External Monitoring: Do you have a system for tracking competitor activity, market trends, and supply chain risks?
- Feedback Loop: Do you analyze past forecast errors to understand why you were wrong and prevent it from happening again?
By methodically working through these questions, you can move from simply reacting to bad forecasts to proactively identifying and neutralizing the hidden killers that are dragging your accuracy down.
Actionable Strategies to Improve Your Forecast Accuracy

Knowing your forecast is off is one thing; knowing how to fix it is another entirely. Boosting your demand forecast accuracy isn’t about buying a magic piece of software. It’s about building a disciplined approach that brings your data, processes, and people into alignment.
We’ve broken down these high-impact strategies into three core pillars. By concentrating on these areas, custom manufacturers can build a more resilient and predictive operation, shifting from constantly putting out fires to proactively planning for what’s next. The goal here is steady, sustainable improvement that shows up on the bottom line.
Strengthen Your Data and Technology Foundation
The most sophisticated forecasting model in the world is worthless if you feed it garbage data. Your journey to better accuracy has to start with the quality and accessibility of your information. Think of it like preparing a job site before you start building—a clean, organized foundation prevents a world of hurt later on.
First up, conduct a thorough data audit. Get in there and scrutinize your historical sales data for inaccuracies, duplicates, and missing details. A classic mistake is failing to tag promotional sales or massive one-off orders, which can throw off your baseline demand and warp future predictions.
Once your data is clean, the next move is integration. Your ERP and CRM systems are absolute goldmines of information, but only if they talk to each other.
- ERP Data: This is where you find the ground truth on production lead times, material availability, and actual shipment dates. Tying this in keeps your forecast grounded in reality.
- CRM Data: Your CRM is your window into the future, tracking the sales pipeline, client conversations, and potential big deals. This gives you a forward-looking view that historical data alone just can't provide.
Finally, start exploring modern tools. AI and machine learning algorithms can chew through massive datasets to spot subtle patterns—like hidden seasonality or the ripple effects of economic indicators—that are nearly impossible for a human to see. These systems can give your demand forecast accuracy a serious lift, especially when dealing with a complex mix of products.
Foster True Process and Collaboration
Even with perfect data and the best tools, a forecast created in a vacuum is destined to fail. Organizational silos are the enemy of accuracy. When sales, operations, and finance are all working from different sets of assumptions, you end up with a plan that reflects internal friction, not market reality.
The answer is a robust Sales and Operations Planning (S&OP) process. This isn't just another meeting on the calendar; it's a structured, recurring forum where department leaders hammer out a single, consensus forecast. An effective S&OP process drives accountability and guarantees everyone is reading from the same playbook.
A successful S&OP cycle is built on transparency and trust. It creates a formal feedback loop where the sales team’s market intelligence informs the operational plan, and operations’ capacity constraints provide a reality check on sales ambitions.
Getting started is simple: schedule the first meeting. Get the key players from sales, marketing, operations, and finance in the same room. The initial goal is just to share information and see where the different departmental forecasts don't line up. That act alone often reveals major communication gaps and lays the foundation for a truly unified approach.
Refine Your Forecasting Methodology
Not all products are created equal, so why would you use a single forecasting method for all of them? A one-size-fits-all model is incredibly inefficient. You end up wasting analytical horsepower on low-impact items while neglecting the products that actually drive your business.
Start by segmenting your product catalog with an A-B-C analysis based on sales volume or profit margin. This lets you apply different levels of forecasting rigor where it counts the most.
- A-Items: These are your high-value, critical products. They deserve your best tools—sophisticated statistical models and deep collaborative input.
- B-Items: Your mid-tier products. A simpler statistical model paired with a periodic review is usually more than enough.
- C-Items: The low-value, high-volume stuff. For these, a basic moving average or even a simple reorder point system is far more cost-effective than intensive forecasting.
For custom manufacturers, it’s also vital to separate standard components from truly bespoke, one-off projects. These custom jobs often depend on qualitative forecasting—relying on sales pipeline data and direct customer conversations rather than historical trends. Matching the right method to the right product is how you optimize your efforts for the biggest accuracy gains. To support this granular approach, exploring the features of an integrated platform like TimberCloud can help unify sales and production data, making segmented forecasting more manageable and effective.
Answering Your Top Forecasting Questions
As you start dialing in your forecasting process, a few practical questions always seem to pop up. Let's tackle these common hurdles head-on so you can move forward with confidence and build some real momentum.
Many teams want to know how long it takes to see a genuine improvement in demand forecast accuracy. You might see some small wins within a single quarter, but significant, stable gains usually take about six to nine months to materialize. This gives you enough time to roll out new processes, get your data in order, and run through a few complete S&OP cycles.
What Is a Realistic Accuracy Target?
Another big question is what a realistic accuracy target even looks like. As we've covered, this number is going to be unique to your business and the products you make. Instead of chasing a generic industry benchmark, zero in on your A-Items—the products that are most critical to your success.
A great starting point is aiming for 85% accuracy for this specific group. Why? Because getting it right here will have the biggest and fastest impact on your finances.
The goal isn't perfection across the board. It's about achieving strategic precision where it matters most to your bottom line. Prioritize, measure, and then expand your efforts.
Where Should We Start?
Finally, the most common question of all is simply, "Where on earth do we start?" It can feel overwhelming, but you can get the ball rolling with just a few focused actions.
- Step 1: Data Audit. First things first, take a hard look at your data. You can't build a reliable forecast on a shaky foundation.
- Step 2: First S&OP Meeting. Get your key stakeholders in a room (or on a call) and get them talking. This initial meeting is crucial for alignment.
- Step 3: Track Key Metrics. Don't try to measure everything at once. Pick one or two core metrics, like MAPE and Bias, and start tracking them consistently.
Taking these first steps creates the framework you need for continuous improvement. If you'd like a hand setting up these foundational processes, our team is ready to help you get started on improving your forecast accuracy.
Topics
TimberCloud Team
Content Team
The TimberCloud team is dedicated to helping manufacturers streamline their operations with intelligent software solutions.